Data Reports
Create customizable dashboards to visualize study data with saved, reusable report pages and widgets.
The Data Reports page enables researchers to create and save customizable dashboards to visualize study data. This section provides tools for building interactive reports with various widgets, such as pie charts, bar charts, and line charts, to present data in a clear and actionable format.
The SMAAT platform’s Data Reports feature supports dynamic data exploration, allowing researchers to tailor visualizations to specific questions or participants. Reports can be saved and revisited, making it easy to track trends and share insights.
Creating a New Report
To create a new report, click the “+ New Report” button on the Data Reports page. Each report consists of one or more pages, which you can add by clicking “+ Add Page.”
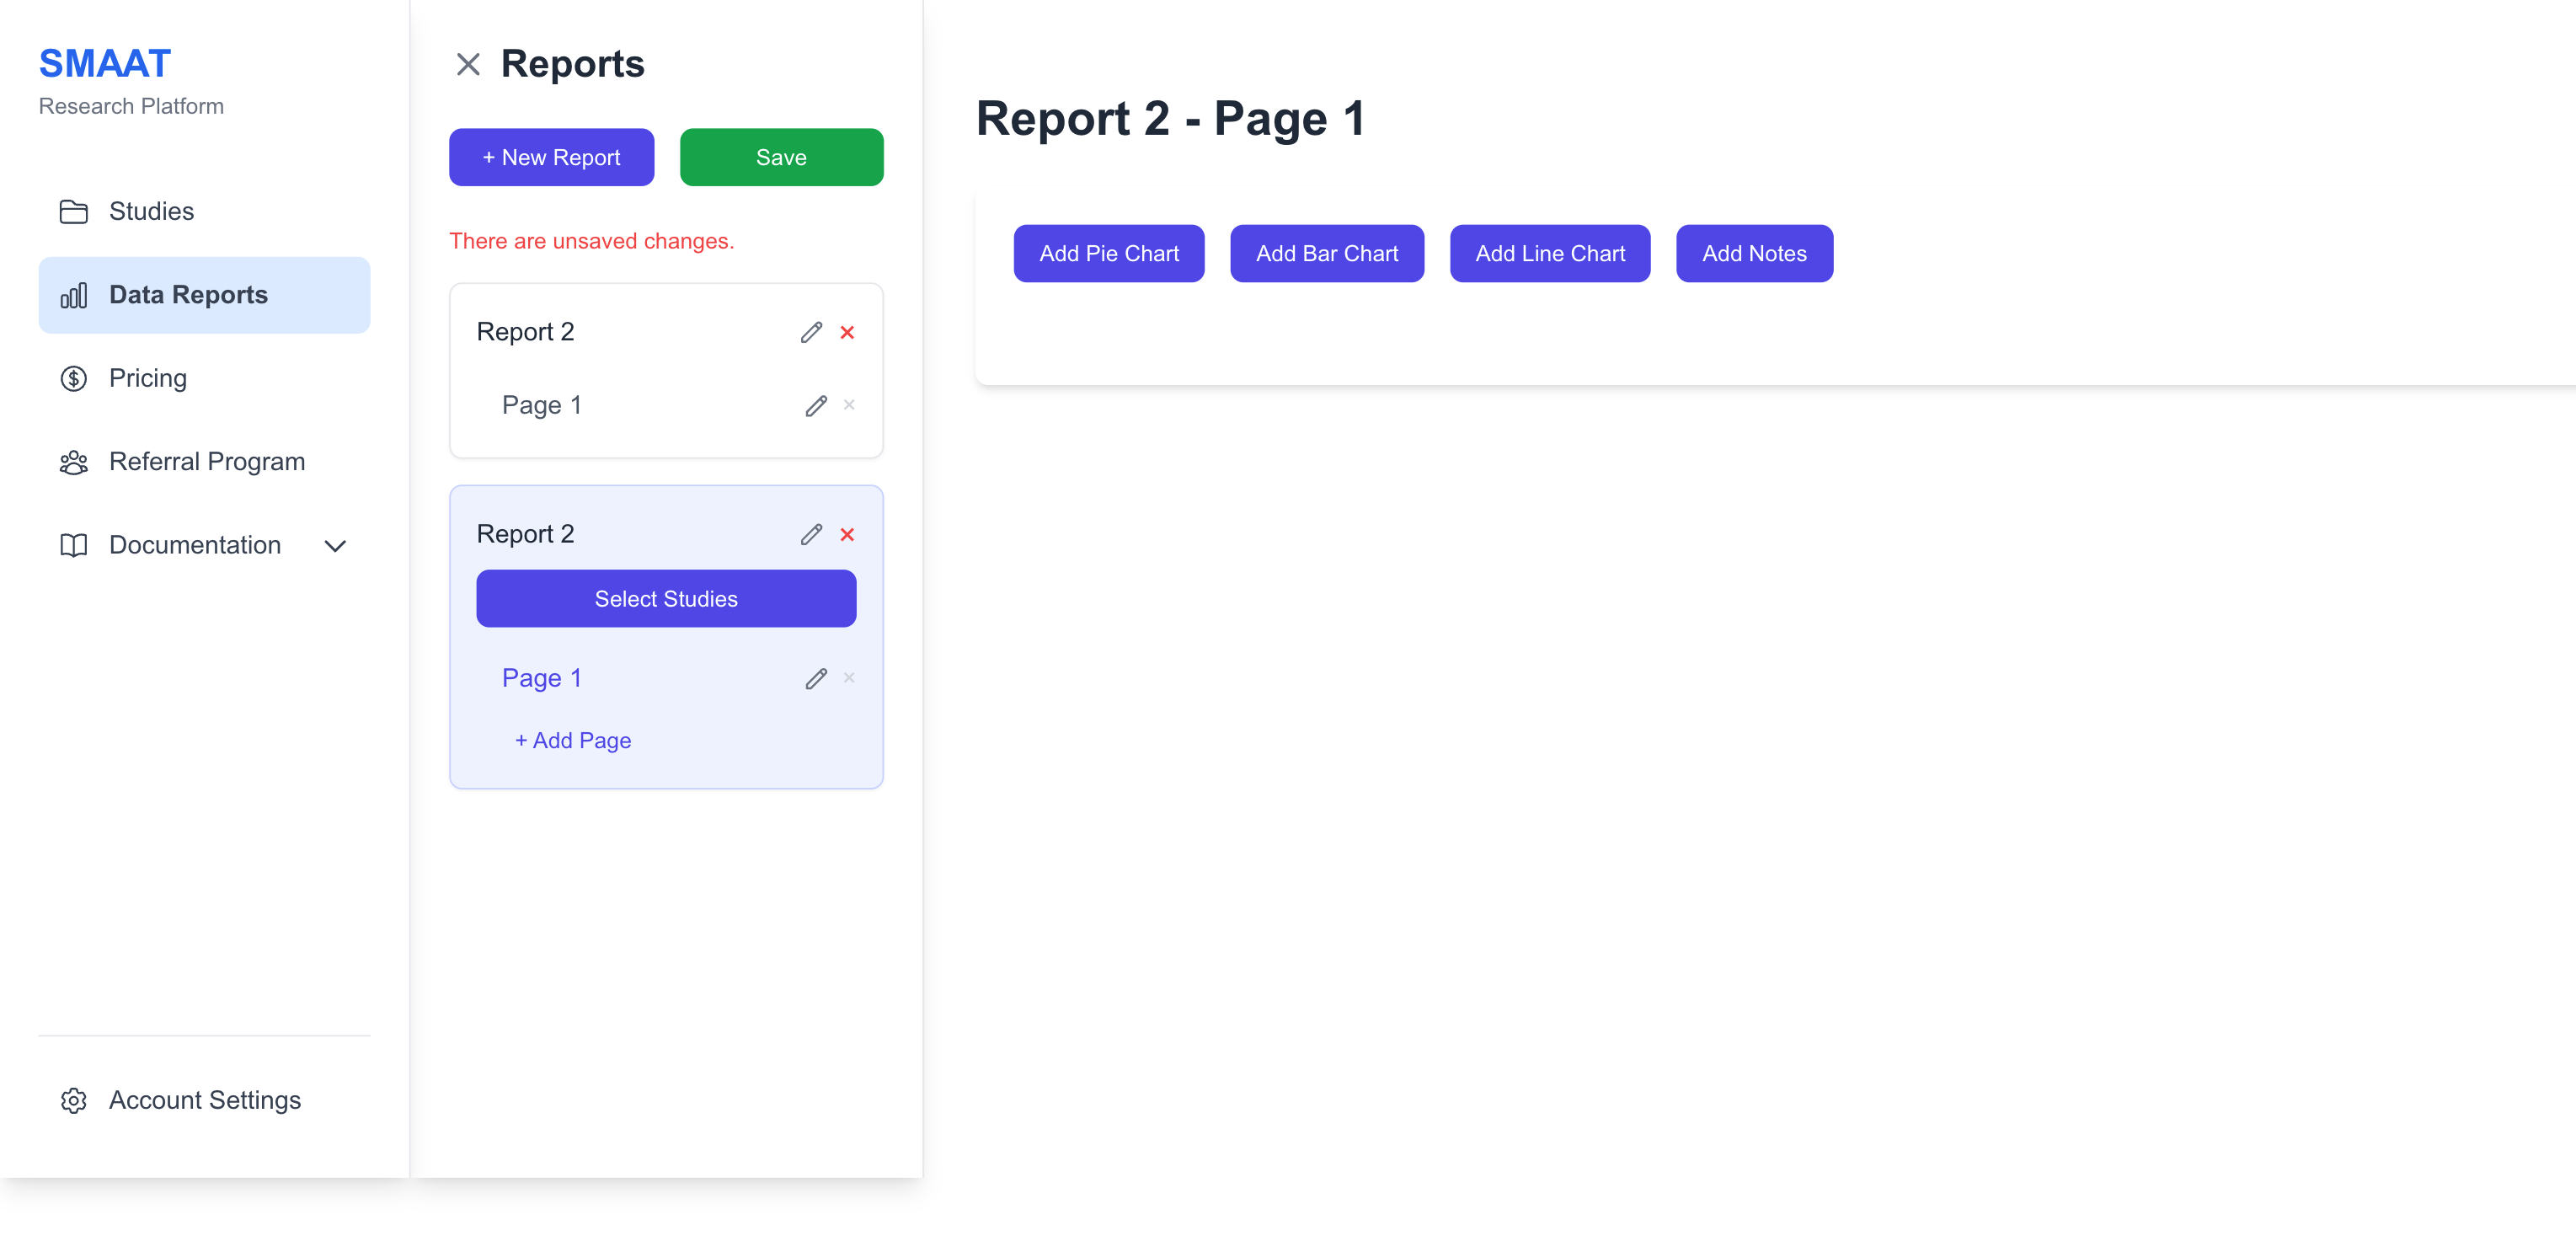
Adding and Customizing Widgets
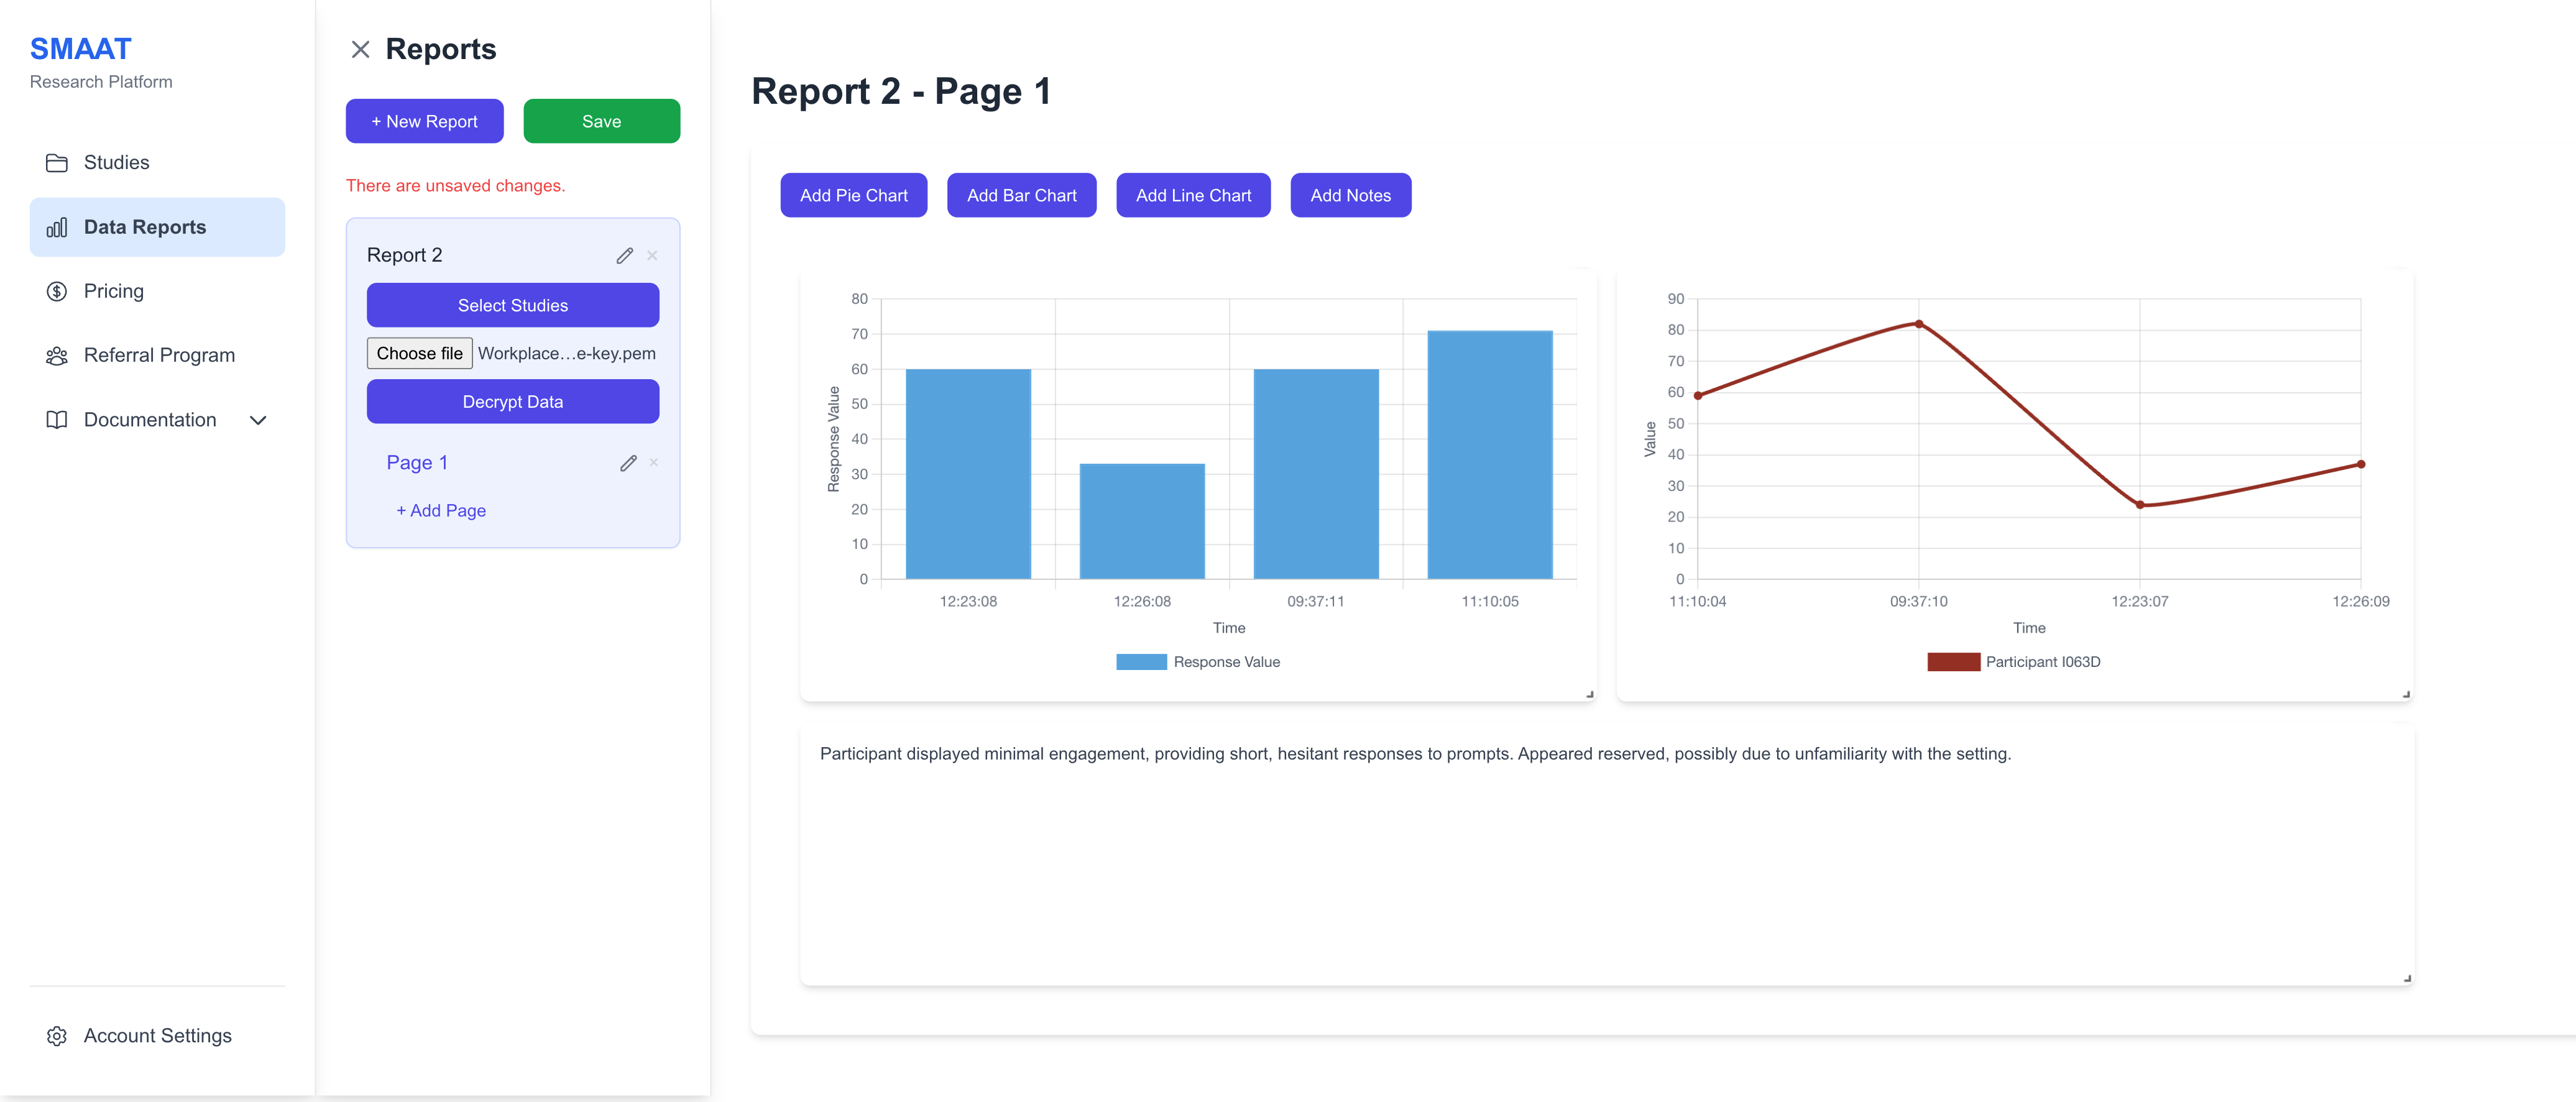
On each report page, add widgets such as pie charts, bar charts, line charts, or notes to visualize data. Widgets can be resized and moved around the page for an optimal layout.
To customize a widget, right-click it to open the settings menu, where you can:
- Select the question or participant data to display.
- Adjust widget-specific options such as chart colors and axis labels.
Right-click the widget again to close the settings menu. Always click “Save” to preserve your report’s current state before leaving the page.
Next Steps
With Data Reports configured, explore the following sections to continue analyzing and managing your research on the SMAAT platform: