Data Explorer
Querying survey responses in the browser with ready-made experience-sampling panels and SQL.
The Data Explorer is opened from Data Explorer in the left sidebar (/dashboard/analysis). It loads the survey responses of one or more studies into DuckDB, an analytical SQL database that runs inside the browser, as a table named responses. The responses are fetched from the SMAAT server in the same way as on the study's Data tab; the queries and charts are then computed on your computer and their results are not sent back to the server.
Experience sampling (ESM), also called ecological momentary assessment (EMA), collects short surveys several times a day in participants' daily lives. The ready-made panels of the Data Explorer cover common descriptive analyses of such data. For file exports, use the Data tab of a study.
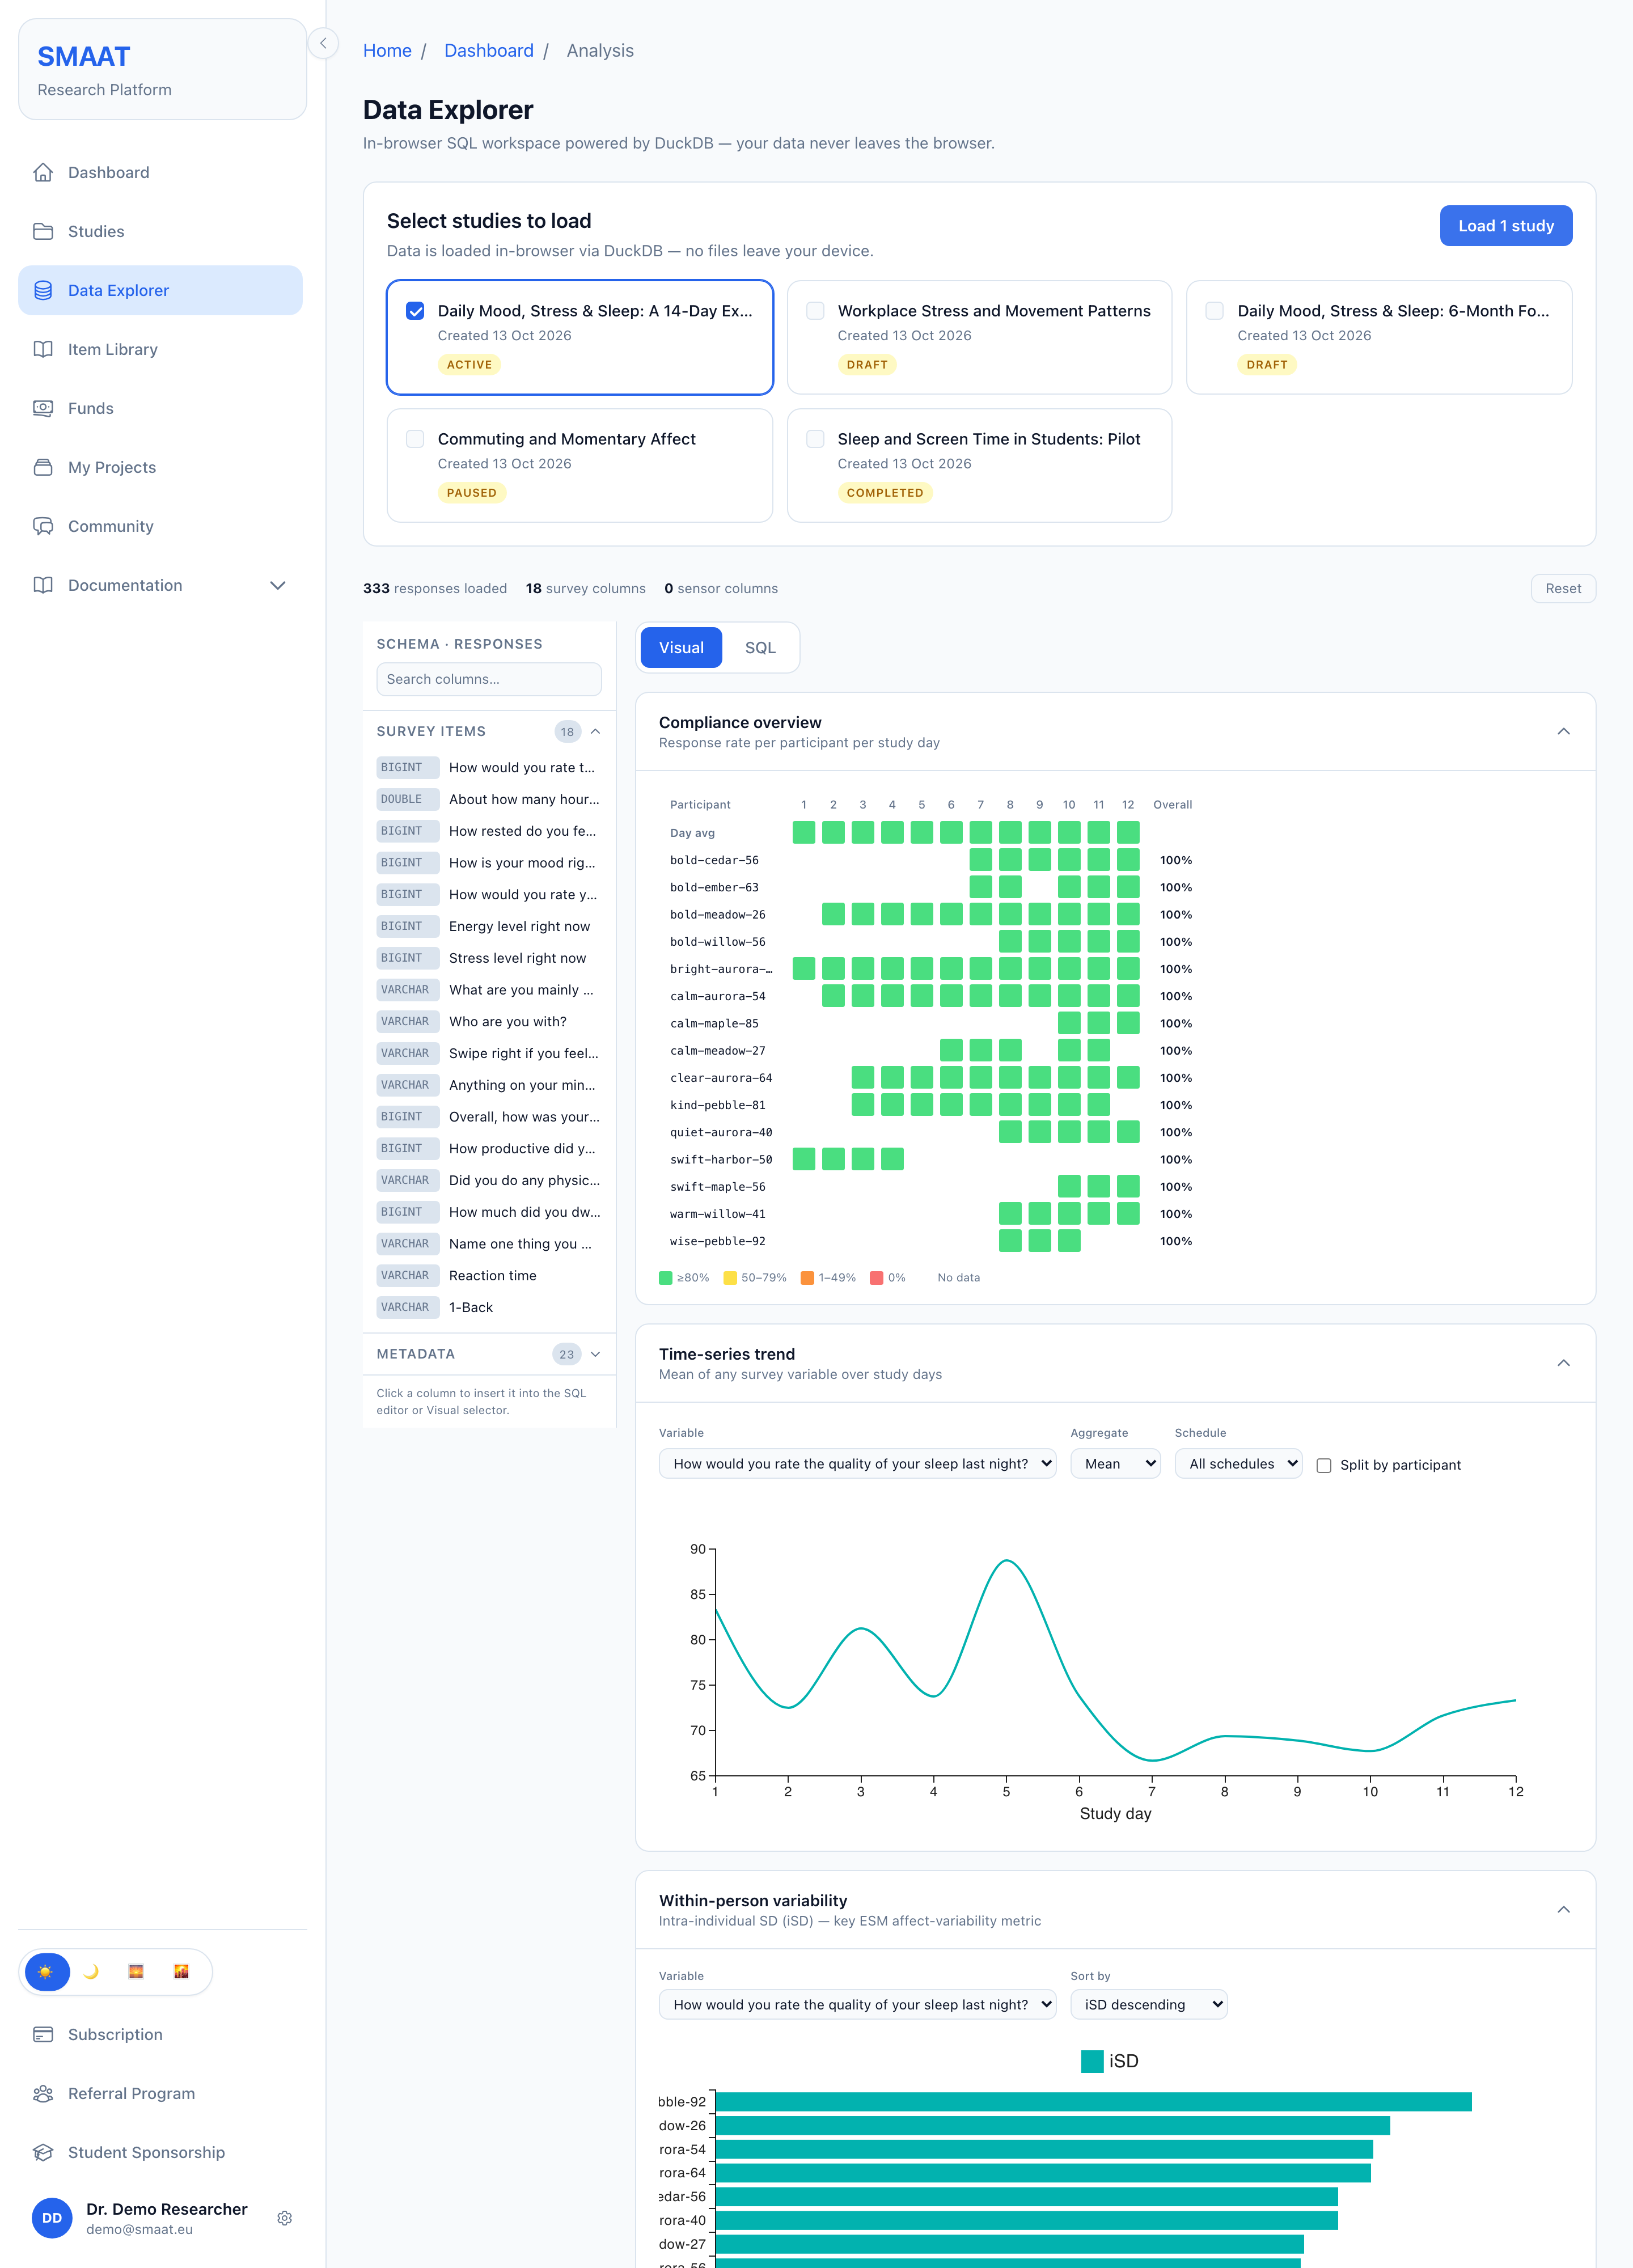
Loading studies
- Under Select studies to load, select one or more study cards. The list contains the studies you have created and the studies shared with you in a project with data access (the project roles Owner and Data analyst, on a study whose author has the Team plan); shared studies carry a Shared badge.
- Select Load. A status line reports the steps (fetching datasets, building rows, starting DuckDB).
- When loading has finished, a bar shows the number of responses loaded and the numbers of survey and sensor columns. Reset clears the loaded data.
Only responses marked Include in Analysis on the study's Data tab are loaded, in the order in which the server received them.
Plan limits
Whether several studies can be loaded together follows your own plan. The number of rows loaded follows the plan of each study's author, so a collaborator loads as many rows of a shared study as its author:
| Plan | Studies per load | Rows loaded |
|---|---|---|
| Free | One | First 100 |
| Basic | Several | First 5,000 |
| Pro, Team | Several | All |
When the row limit cuts off responses, a notice names each study concerned and reads “showing the first ... of ... rows on the study author's plan”, with a link to upgrade on your own studies. Because rows are loaded in order of arrival, the limit keeps the earliest responses of each study.
The responses table
Each row of responses is one survey submission. The schema sidebar on the left groups the columns into Survey items, Metadata and Sensor streams. Hovering a column shows its question text and data type; on the SQL tab, selecting a column inserts its name into the query.
Survey item columns
There is one column per question, named after the question ID. Characters other than letters, digits and underscores are replaced by underscores, and a name that starts with a digit gets the prefix q. Numeric answers are stored as numbers. Structured answers, such as cognitive-task results, are stored as JSON text.
Metadata columns
_participant_id | Participant code. |
_study_id, _study_title | The study the response belongs to. |
_survey_title | Title of the survey. |
_schedule_id | ID of the notification that prompted the survey (empty if none). |
_schedule_label | Prompt type, as labelled in the Data tab: Notification, Reminder, Geofencing, Place Visit, Self-Initiated or Unknown. |
_prompt_type | The stored prompt type id (notification, reminder, geofencing, placeVisit, self-initiated), or empty when unknown. |
_wave | Submission number of this survey for this participant (1 = first). |
_notification_sent_at | Time the notification was sent. |
_response_started_at, _response_completed_at | Start and completion time on the device clock. |
_server_received_at | Time the server received the response. |
_survey_duration_s | Seconds from start to completion, on the device clock. |
_response_time_s | Seconds from sending the notification to the server receiving the response. |
_complied, _compliance_window_s | Whether the response arrived within the response window, and the window in seconds. |
_completed_questions, _total_questions | Answered and presented questions. |
_participant_day | The participant's study day: day 1 is the calendar day of their enrolment (or of their first response, if that is earlier or the enrolment time is unknown), counted in the time zone in which they answered. |
_study_day | Calendar day counted from the first response of the whole study (day 1). |
_session_day | The same as _participant_day (kept for existing queries). |
_group_label | Group assigned to the participant. |
_screen_order | The screens in the order they were shown, for example after randomisation. |
_timezone | Time zone of the participant when responding. |
_data_truncated | True if the response data were truncated because of their size. |
_dataset_id | Internal ID of the response. |
Sensor columns
Sensor columns summarise the sensor readings recorded while the survey was open, one value per submission: _gps_lat and _gps_lon (first location sample), _accel_mean_x, _accel_mean_y, _accel_mean_z and the corresponding _gyro_mean_* columns (means over the survey), _baro_mean, and the health metrics: _steps_total (steps of the day up to the survey), _hr_resting, _active_energy_kcal, _distance_m, _spo2_pct, _resp_rate, _hrv_sdnn_ms (iPhone) and _hrv_rmssd_ms (Android). A column appears only if at least one loaded response contains that sensor.
Visual tab
The Visual tab contains seven panels. Each panel can be collapsed and asks for the variable it should use where needed. All panels are available on every plan.
- Compliance overview: Per participant and participant study day, the share of responses answered within their response window. Prompts that were never answered are not in the responses table, so this is not a response rate; see the response rate on the Data tab.
- Time-series trend: Mean of a chosen survey variable over the participants' study days (_participant_day).
- Within-person variability: Intra-individual standard deviation (iSD) of a variable per participant, a common measure of affect variability in experience sampling.
- Wave comparison: Mean of a variable across waves (submission numbers) or conditions.
- Response time distribution: Histogram of the seconds between notification and completion.
- Lag-1 autocorrelation: The association between a variable at one prompt (t) and at the previous prompt (t-1) of the same person, which indicates carry-over between prompts.
- Response frequency: Count of each answer option, for any question type.
SQL tab
The SQL tab accepts any query that DuckDB supports on the responses table. Write the query in the editor and select Run or press Ctrl+Enter. Query templates fill the editor with a starting point: Preview rows, Compliance by day, Per-participant count, Within-person SD, Response time trend, Wave means, Dropout by day.
The result table shows the first 500 rows. Download CSV saves the complete result as analysis_results.csv. Below the result, a chart builder draws a bar, line or scatter chart from two result columns (X axis, Y axis), optionally split by a third column (Group by).
SELECT _participant_id,
       ROUND(100.0 * AVG(CASE WHEN _complied THEN 1 ELSE 0 END), 1) AS compliance_pct,
       COUNT(*) AS responses
FROM responses
WHERE _participant_day <= 7
GROUP BY _participant_id
ORDER BY compliance_pct
What the Data Explorer does not include
- No background sensor files. GPS streams, health data and task audio from the Sensors tab are not loaded (see Background Sensor Data).
- No raw sensor samples. Sensor data recorded during surveys are reduced to the per-submission summaries listed above. The full samples are in the long-format export of the Data tab.
- No decryption. Encrypted responses are loaded with their metadata columns but without survey item columns. Studies with end-to-end encryption or a self-managed study key therefore show no answers here; analyse them from a decrypted export of the Data tab.
- Own studies only. Studies shared with you through a project are not listed.
- No storage. The loaded table and the query results exist only in the open browser tab. Save results with Download CSV.
_participant_day (and its alias _session_day) counts each participant's own study days from enrolment, so day 3 is every participant's third day whatever the date. _study_day counts from the study's first response, so participants who enrolled later start at a higher day number. Both are calendar days in the time zone where the participant answered, based on the completion time on the phone.