Data Overview
Overview
The Data Overview page, accessible from the study dashboard, provides a comprehensive interface for downloading and analyzing study data. This section allows researchers to view datasets, response rates, and answer distributions for each survey question. With flexible filtering and analysis options, the Data Overview page ensures you can effectively manage and interpret your study data.
The SMAAT platform offers robust tools for data management, including the ability to decrypt encrypted data, exclude specific datasets from analysis, and inspect individual responses. These features support diverse research needs while maintaining data integrity and security.
Accessing Data Overview
From the study dashboard, navigate to the Data Overview page to access all collected datasets. The top menu allows you to download individual responses or response statistics (e.g., response rates) as CSV files. If your data is encrypted, upload your private key here to decrypt it before downloading.
Example: For a study on daily mood, download response statistics to analyze completion rates across participants over a 30-day period.
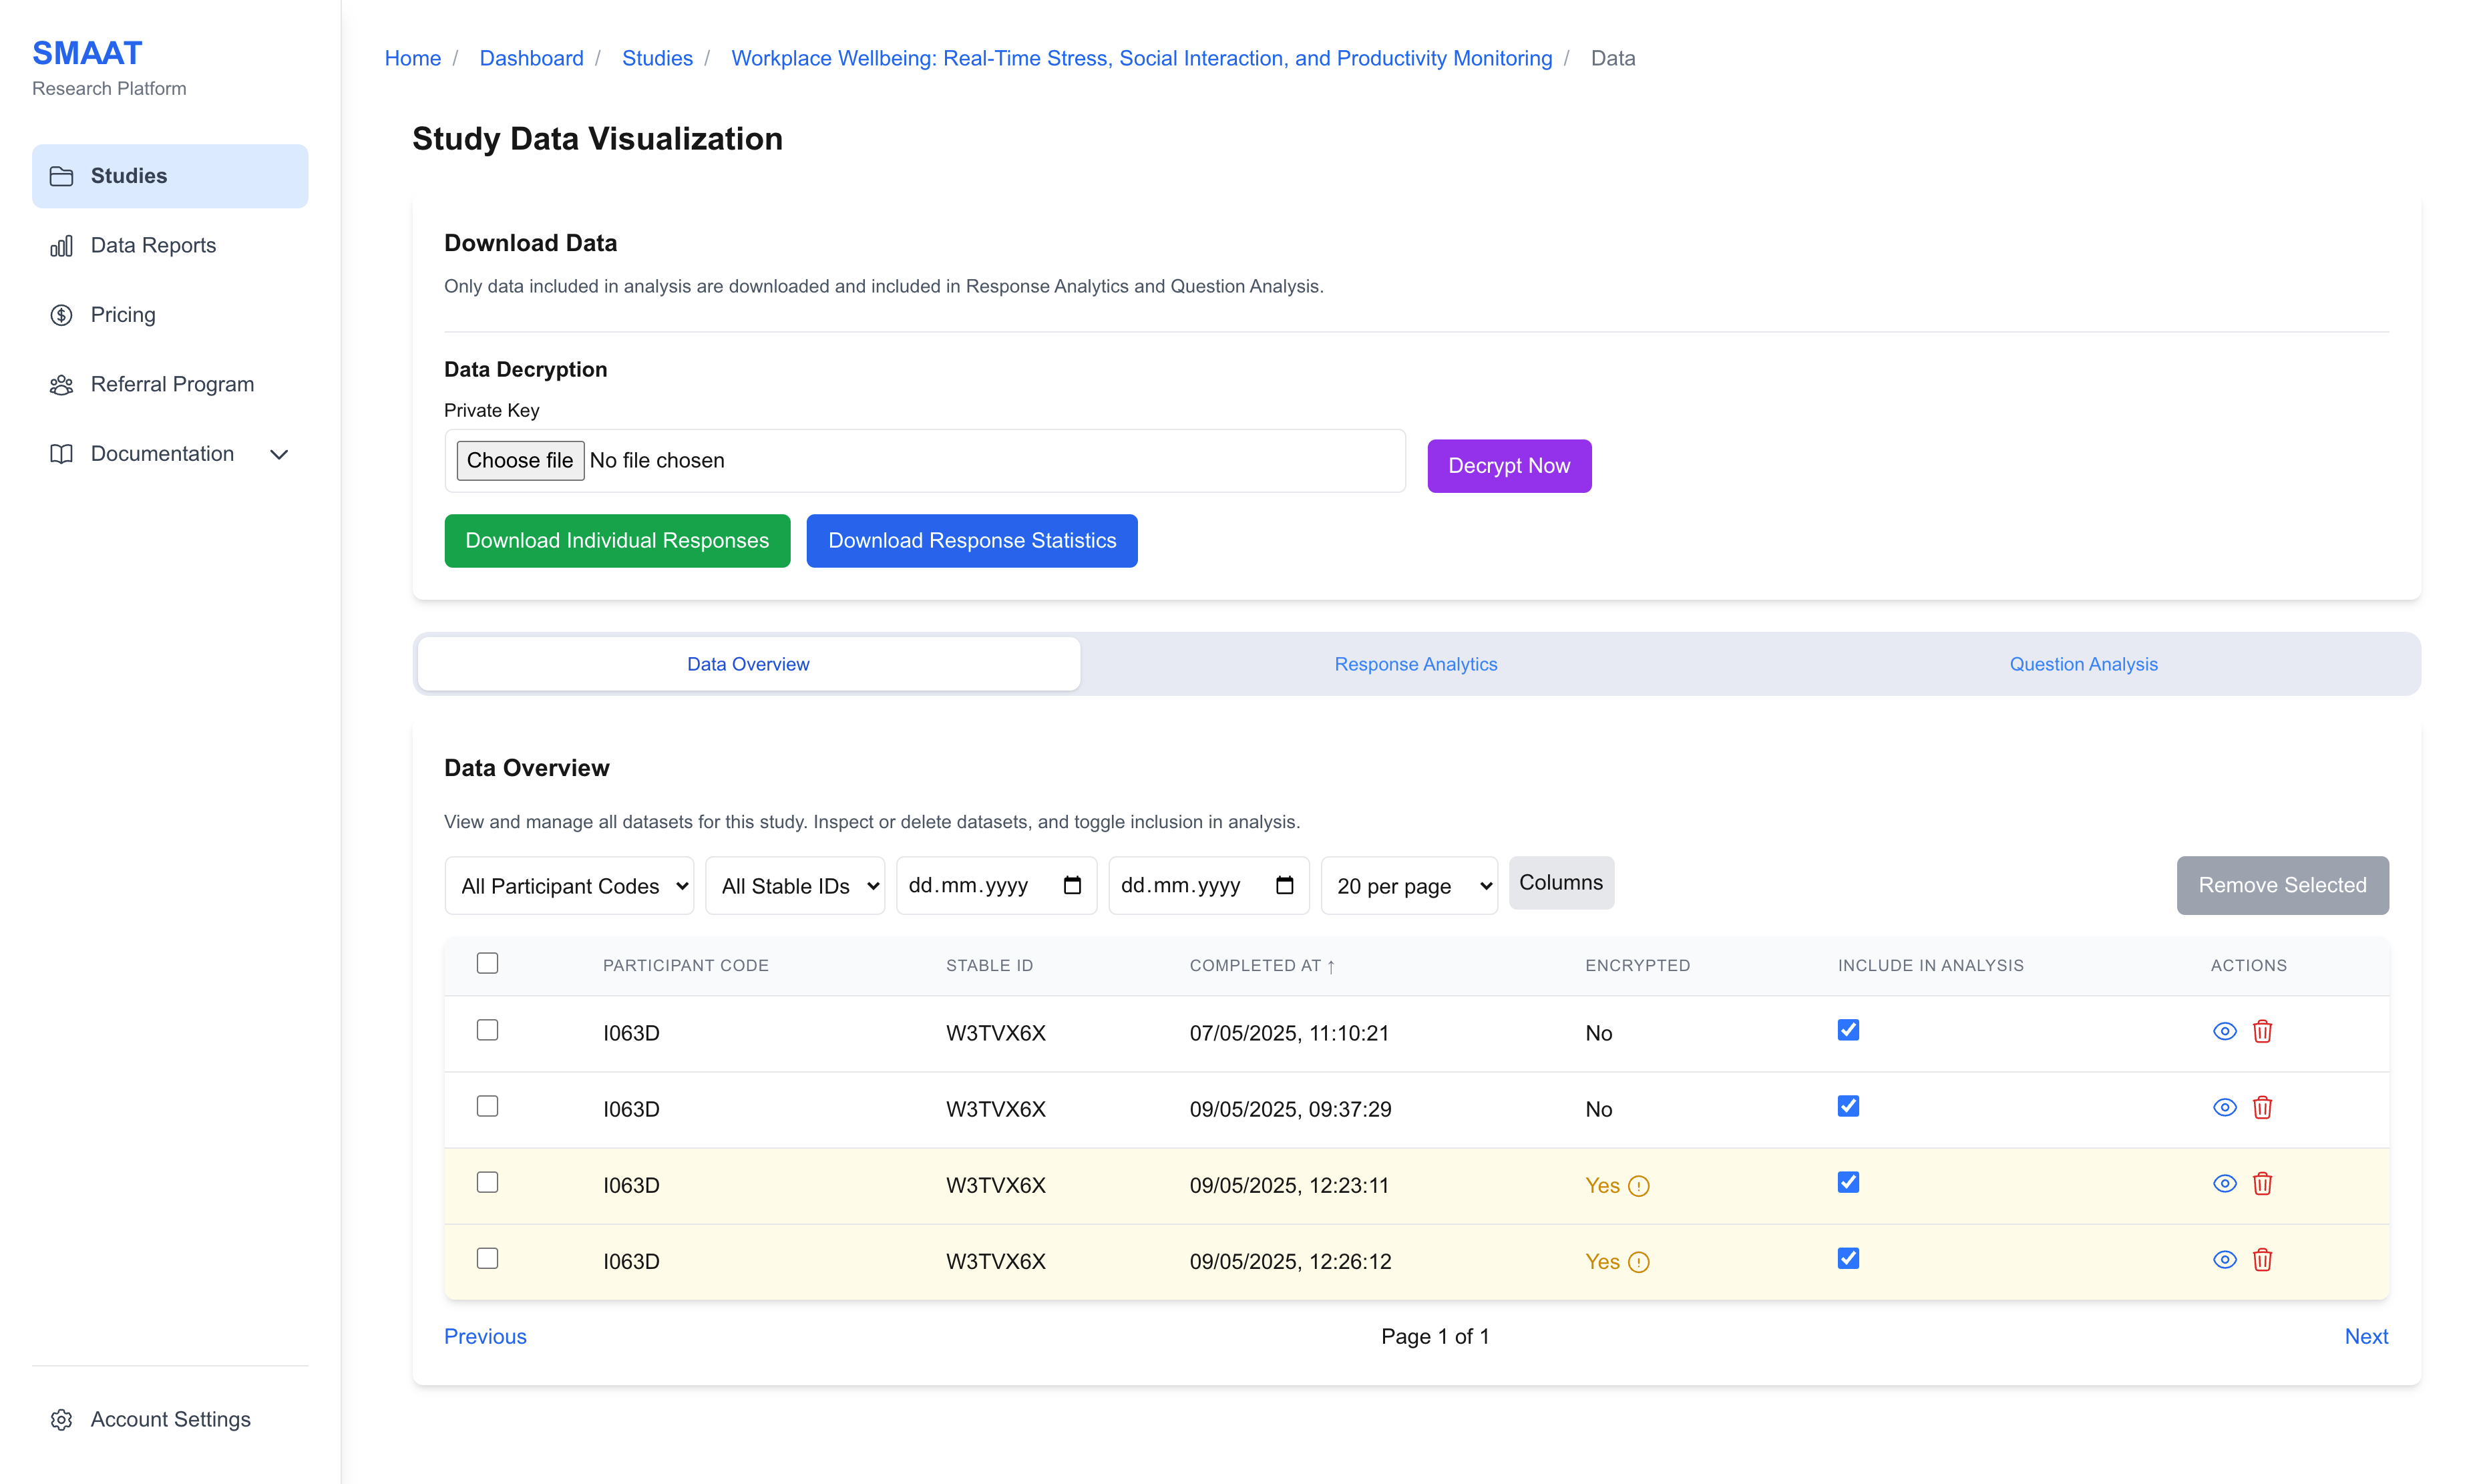
Data Overview Tab
The Data Overview tab displays all collected datasets in a table. By default, all datasets are included in analysis. You can exclude specific datasets by toggling off the checkbox in the “Include in Analysis” column. Excluded datasets are not included in Response Analytics, Question Analysis, or downloaded files.
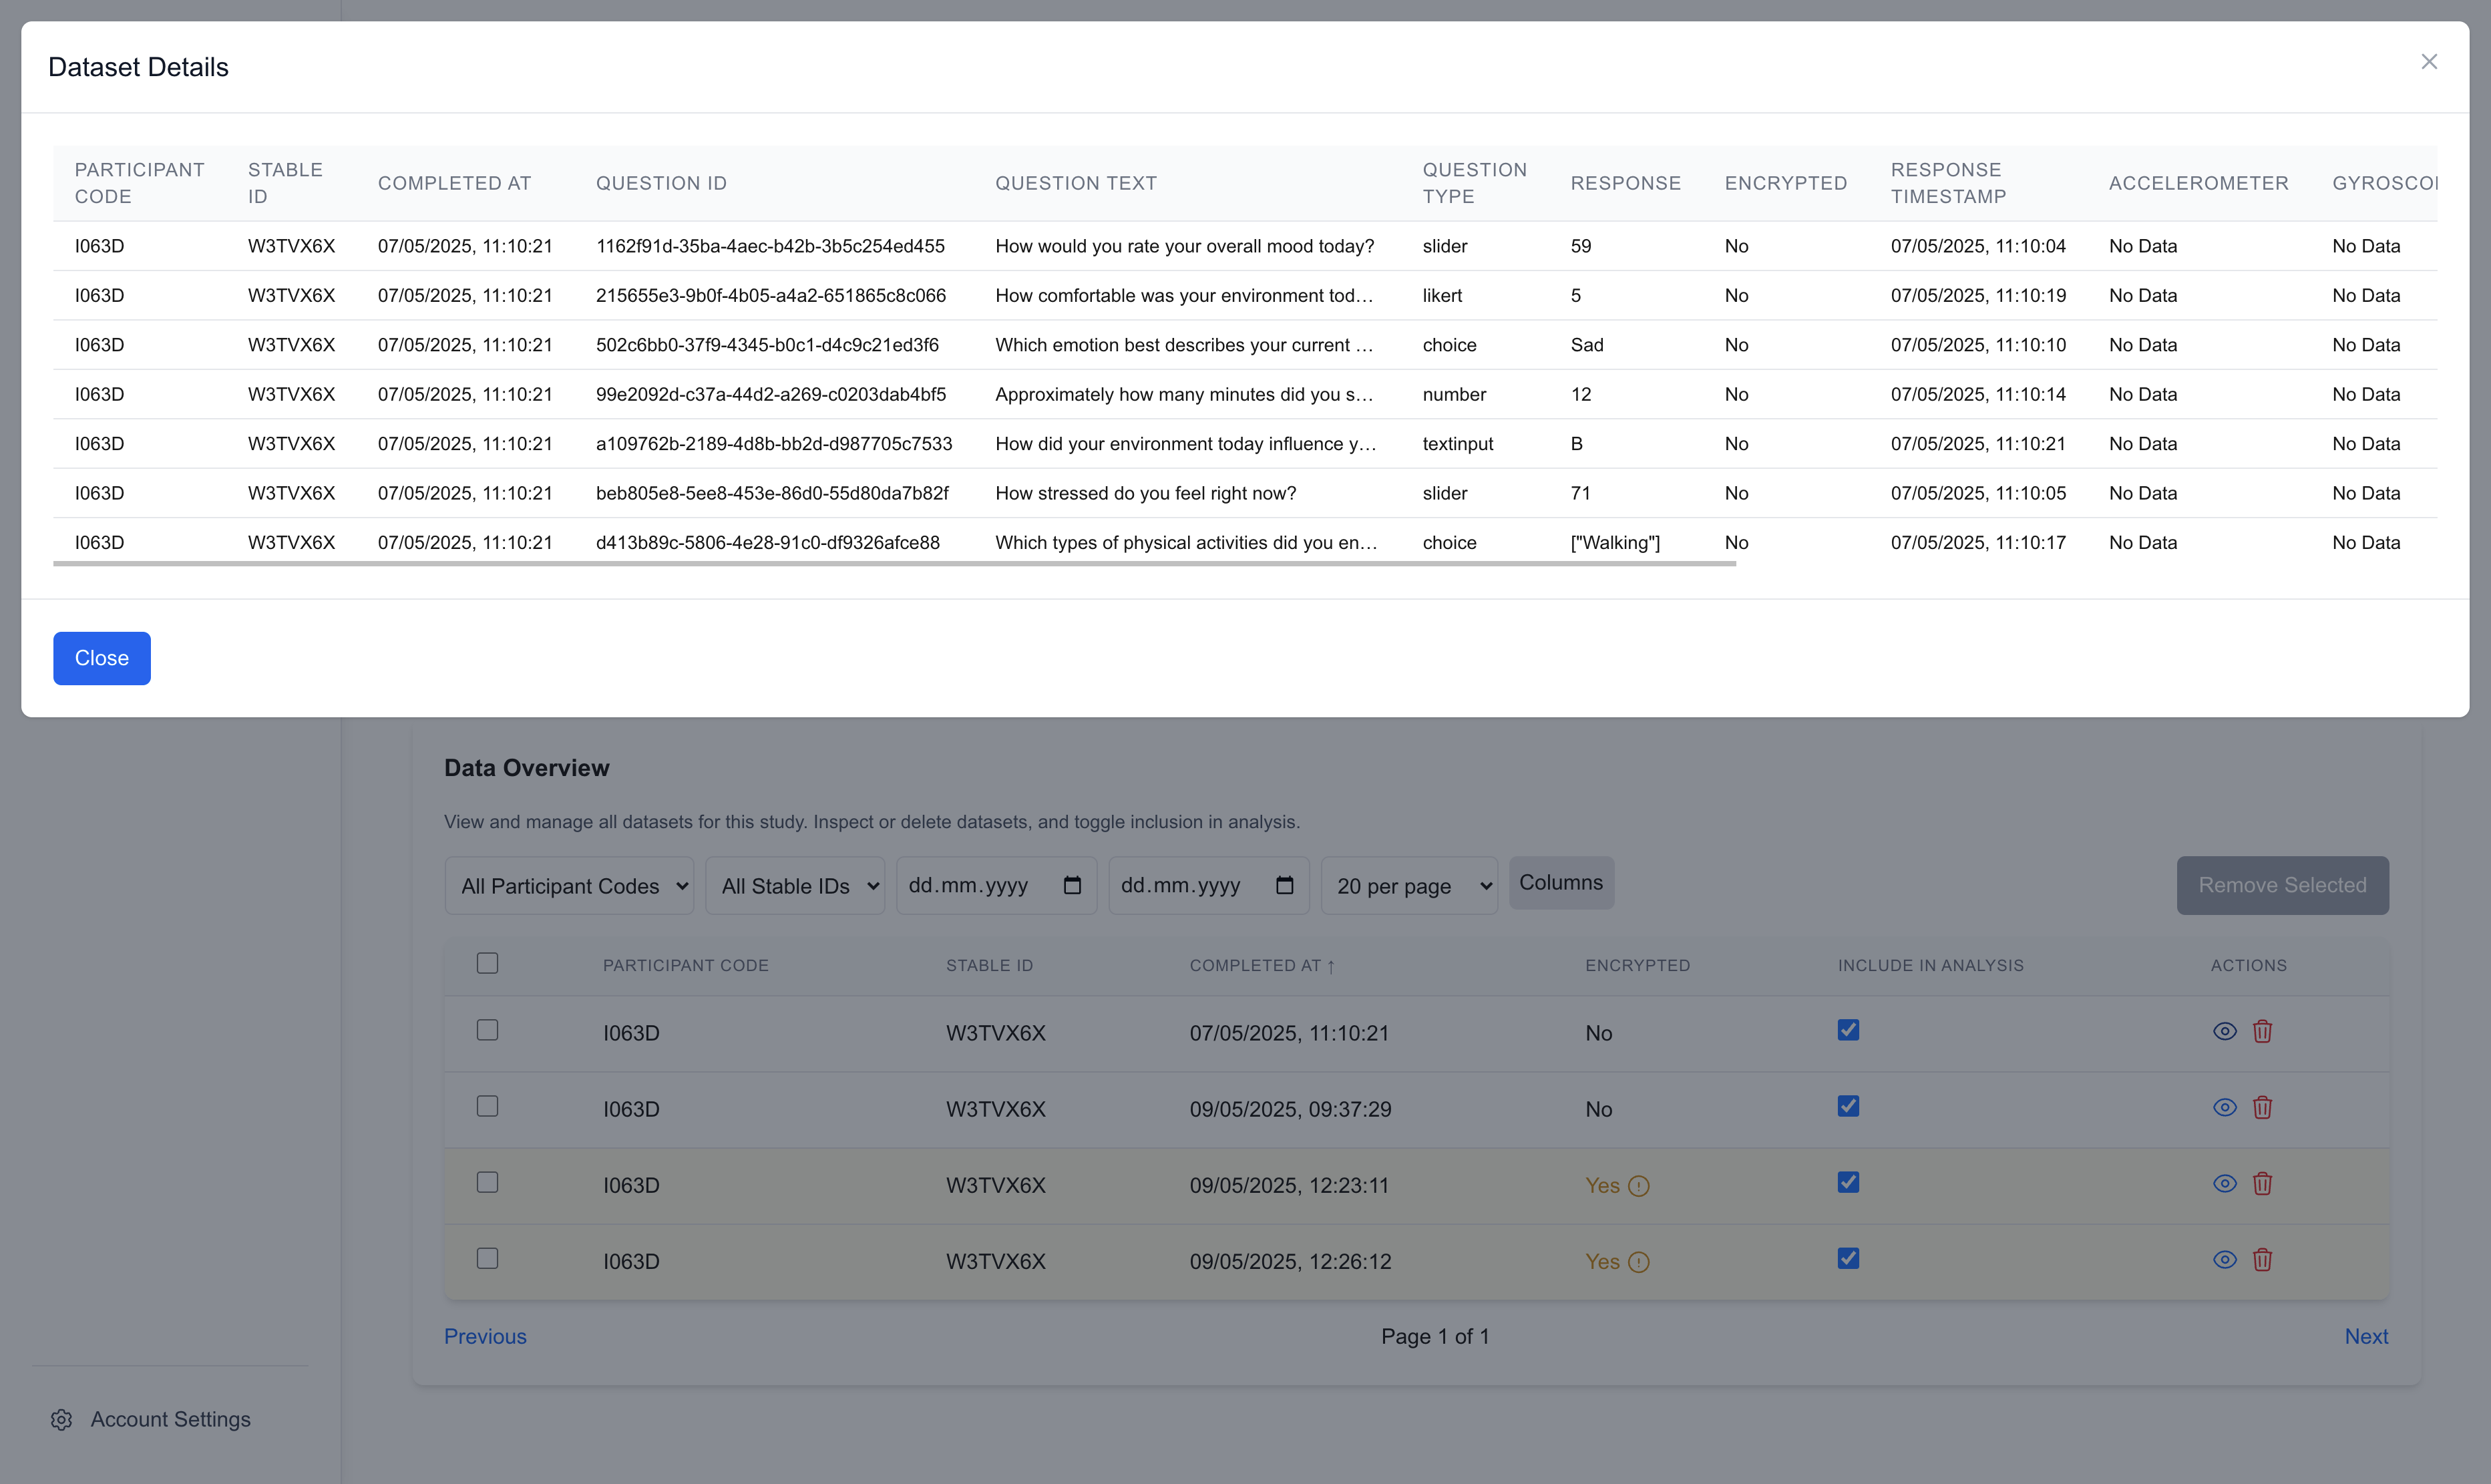
Use filter options at the top of the table to explore datasets by participant code, stable participant ID, or date range. You can also customize the number of rows per page and select which columns to display. To inspect a dataset, click the eye icon in the “Actions” column. Datasets can be deleted individually or in bulk.
Example: Filter datasets for a specific participant (e.g., “P123”) to review their survey responses from the past week.
Troubleshooting Tip: If a dataset is missing, verify your filter settings or ensure the participant has completed the relevant surveys.
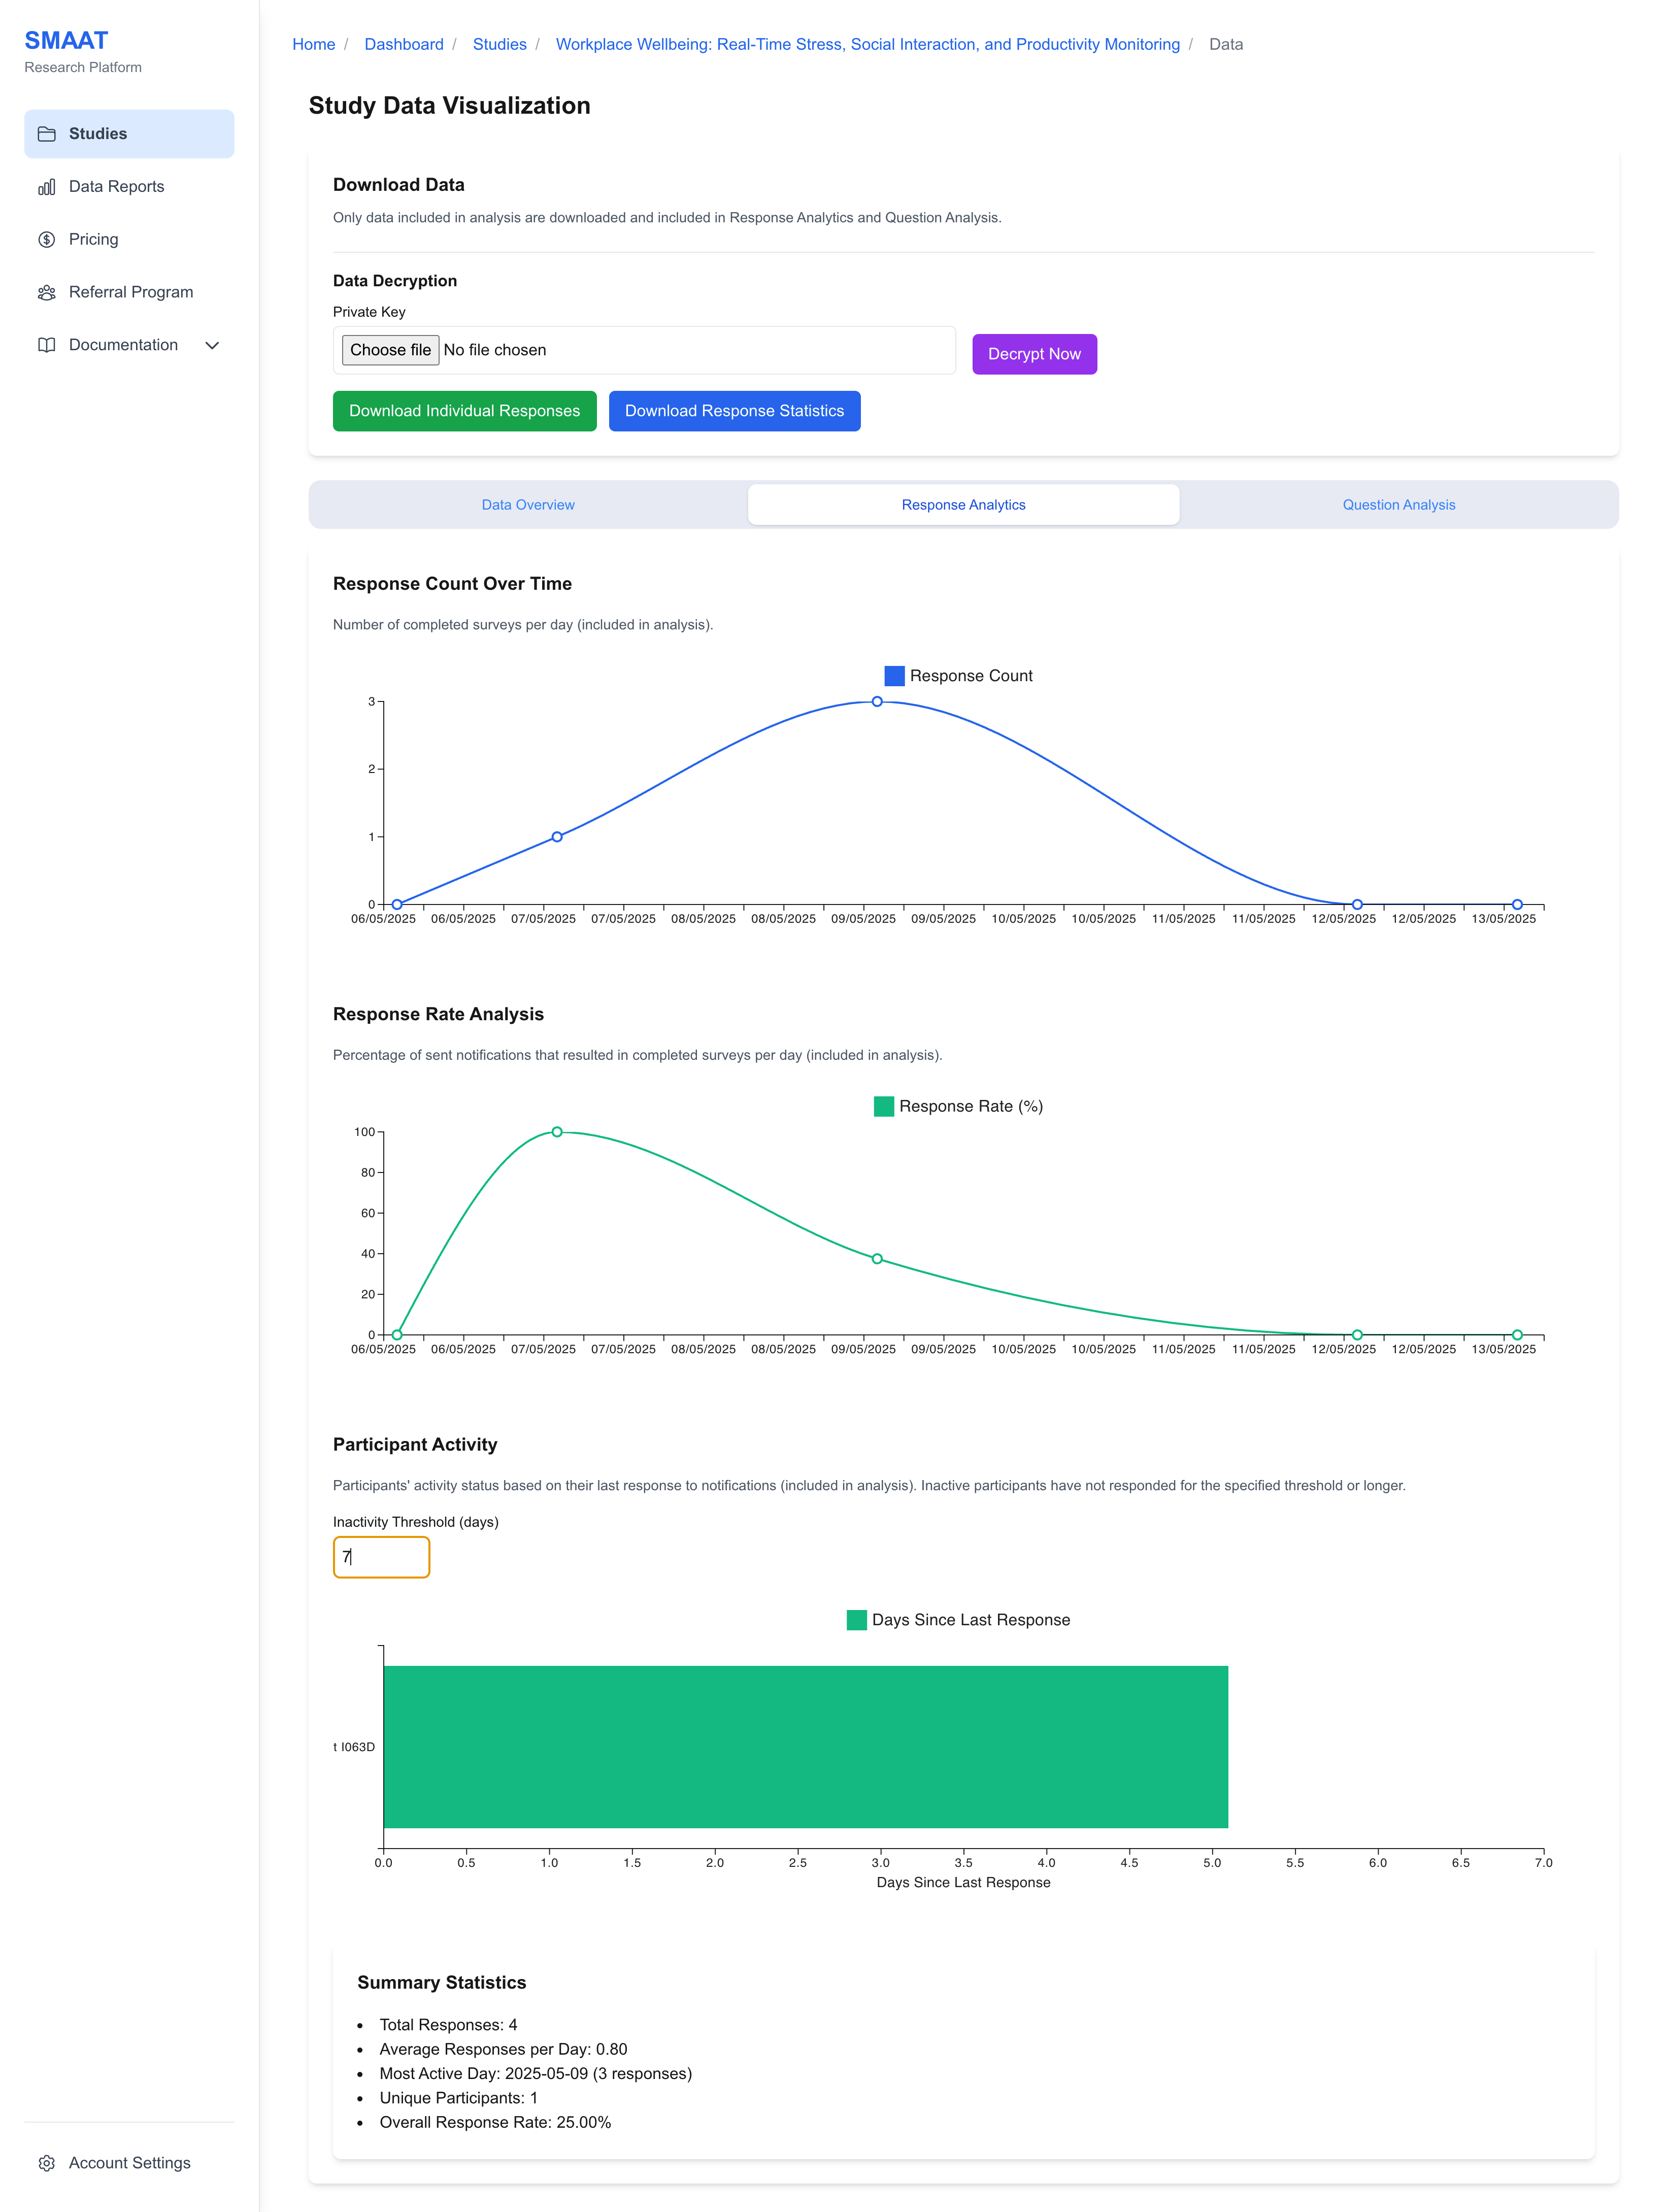
Response Analytics Tab
The Response Analytics tab provides insights into response counts, response rates, and participant activity. Key metrics include:
- Response Count: Displays the number of completed surveys per day.
- Response Rate: Shows the percentage of sent notifications that resulted in completed surveys per day.
- Participant Activity: Highlights participants who have not responded to notifications for a specified period (inactivity threshold, e.g., 1 day). Inactive participants are highlighted in red.
Example: Set the inactivity threshold to 2 days to identify participants who have not completed surveys in the last 48 hours, allowing you to send follow-up reminders.
Troubleshooting Tip: If response rates are lower than expected, check notification schedules in the Study Management settings to ensure they align with participant availability.
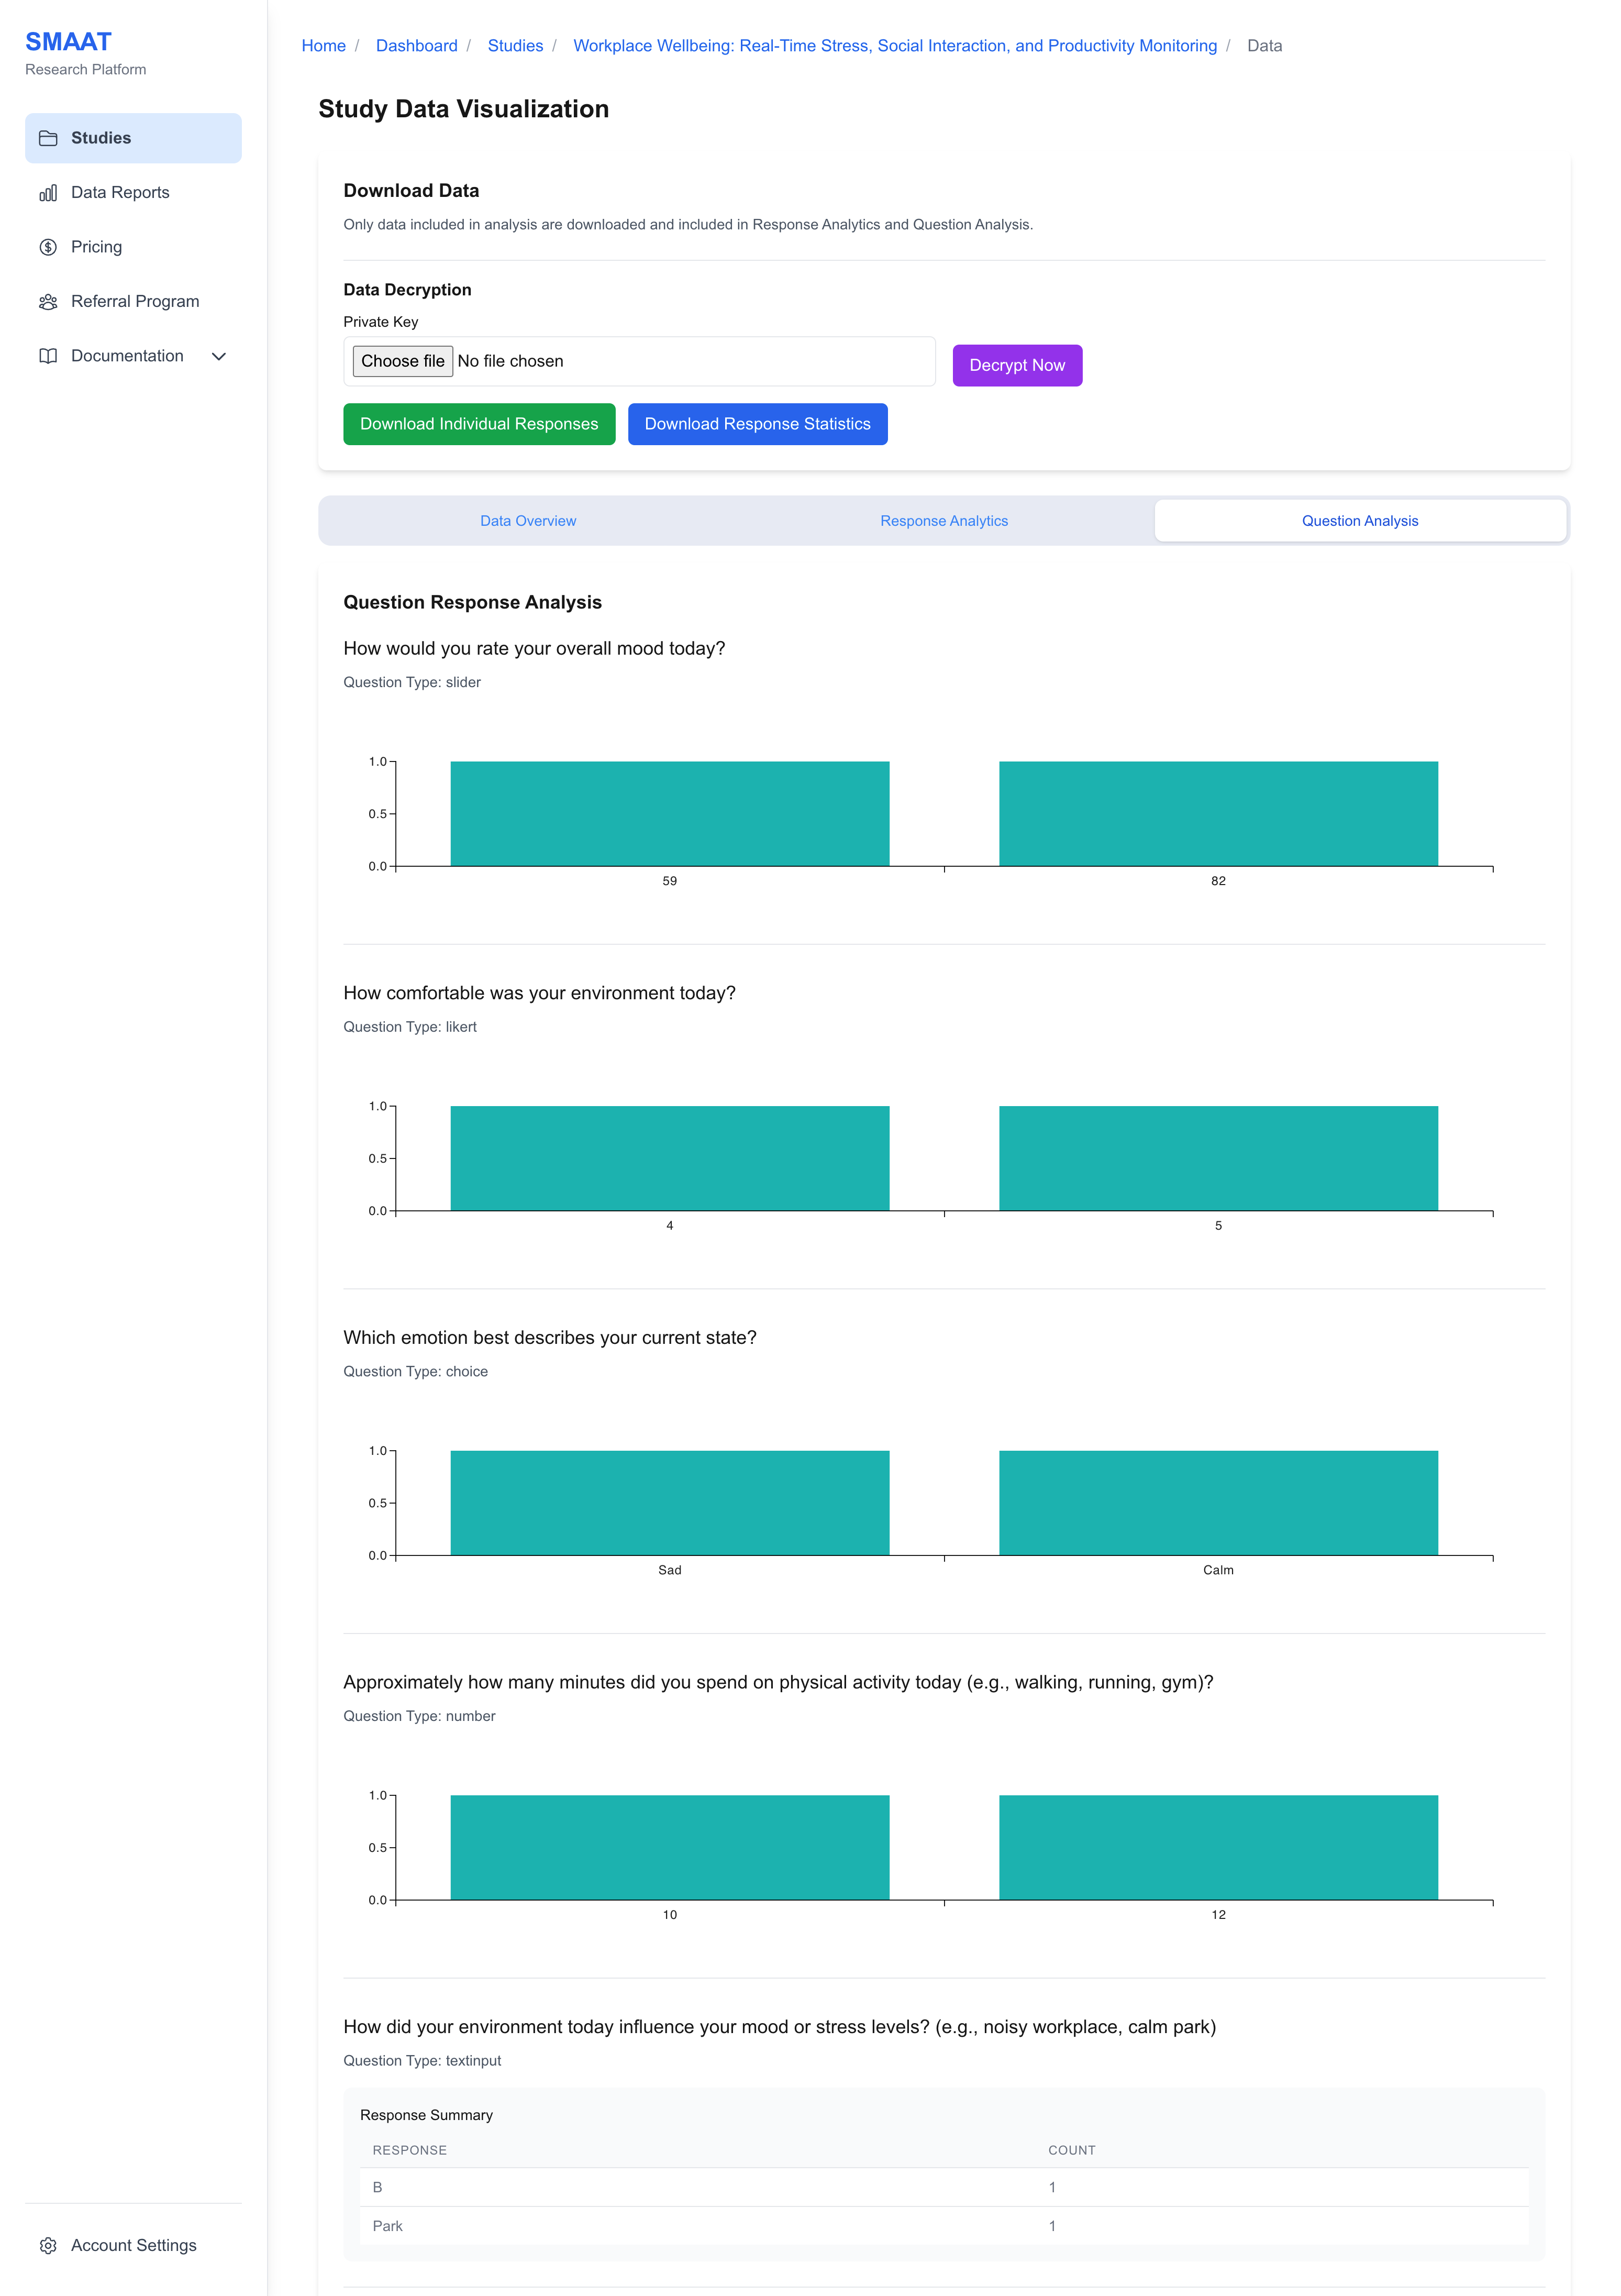
Question Analysis Tab
The Question Analysis tab displays the distribution of answers for each survey question individually. For questions with file upload types (e.g., images, videos, audio), you can download the uploaded files directly from this tab.
Example: For a survey question asking participants to upload a photo of their environment, download the images to analyze visual data trends.
Troubleshooting Tip: If answer distributions seem incomplete, ensure all relevant datasets are included in the analysis (check the Data Overview tab).
Next Steps
With the Data Overview page configured, explore the following sections to continue analyzing and managing your research on the SMAART platform:
Data Analysis
- Background Sensor Data: Analyze passive sensor data collected from participants.
- Data Reports: Create customizable dashboards to visualize study data.
- Frequently Asked Questions: Find answers to common questions about the SMAAT platform.