Data Quality & Limitations
The data-quality signals that SMAAT records, where they are shown, and the limits to consider when interpreting them. Most of these views are on the study's Quality and Burden tabs.
The Quality Centre
Open a study and select the Quality tab. The page, labelled Quality Centre and headed Data & Compliance Quality, has four tabs: Compliance, Missing Data, Data Quality and Change Log. The tab is available to the study author and to project collaborators with data access. Plan-dependent parts follow the plan of the study author.
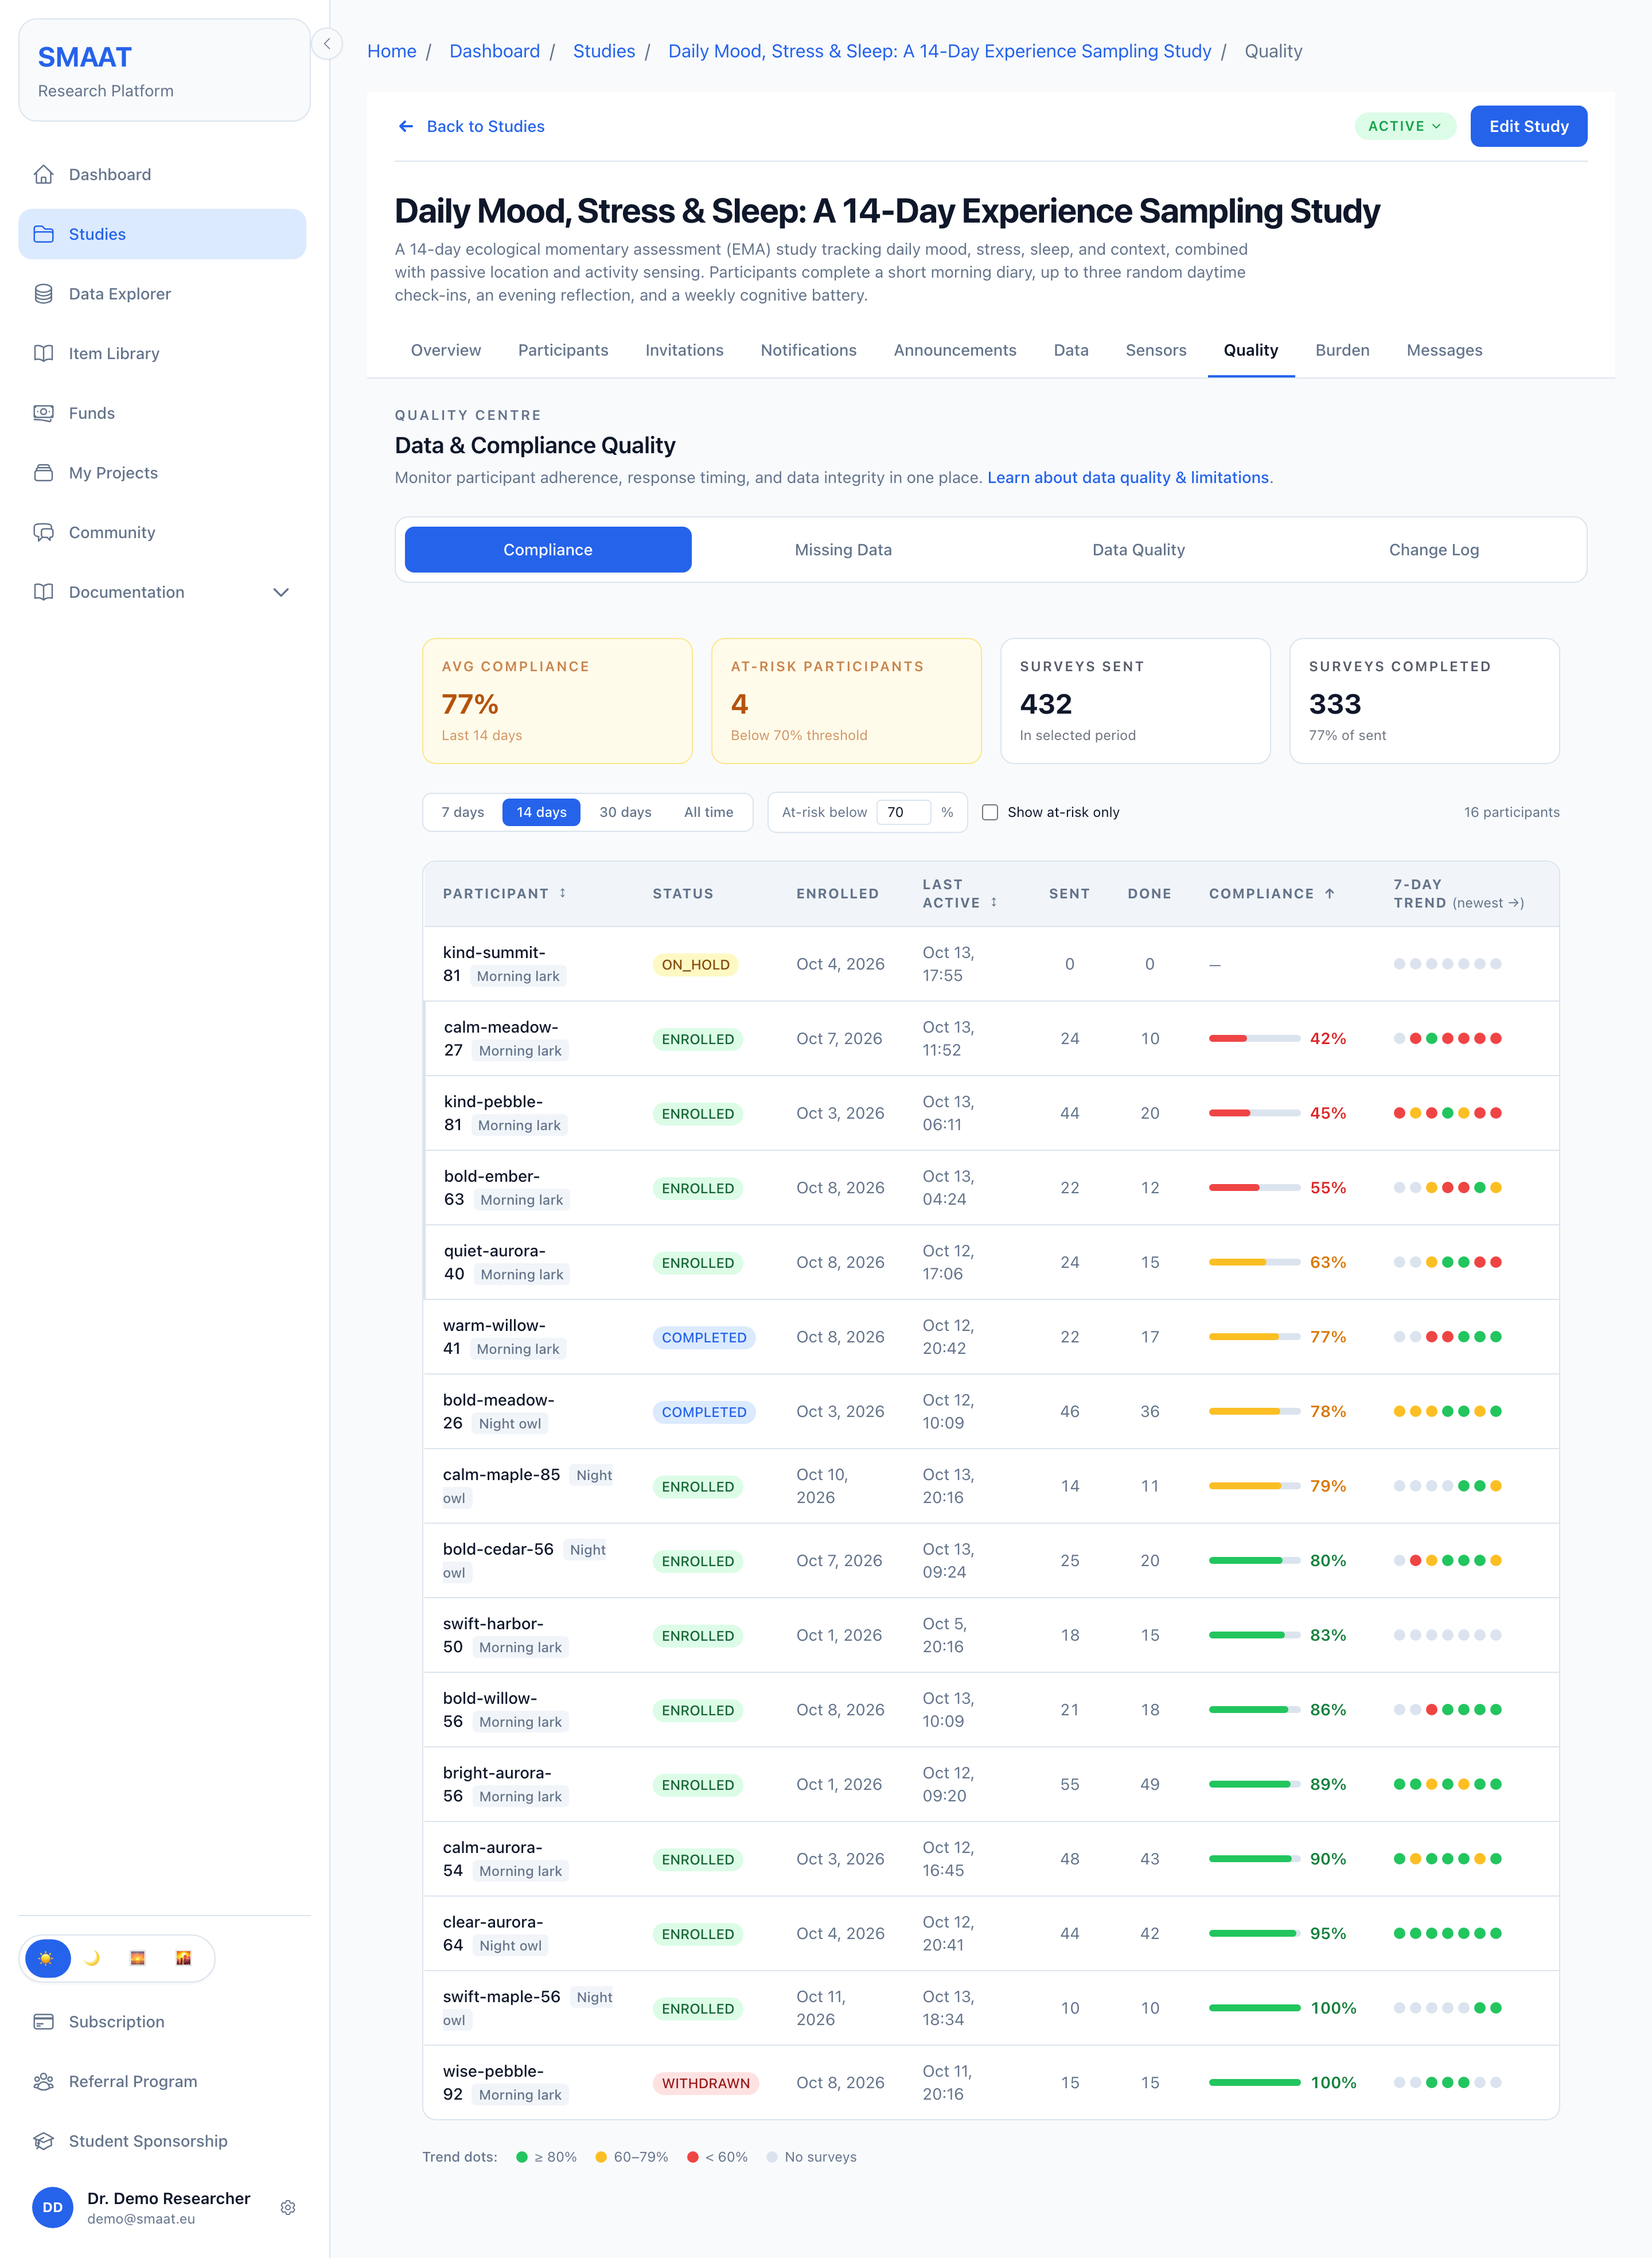
Compliance tab
Compliance (the share of prompts a participant answers) is summarised in four cards: Avg compliance, At-risk participants, Surveys sent and Surveys completed. On this tab, a participant's compliance is the number of survey notifications with the status Completed divided by the number of survey notifications sent in the selected period. Announcements are not counted. The average is the mean of the participants' rates.
The per-participant table requires the Basic plan or above. Buttons select the period (7 days, 14 days, 30 days, All time; default 14 days). Participants below the At-risk below percentage count as at risk. It starts at the study's Compliance Alerts threshold (70 % if none was saved) and can be changed on the page, and Show at-risk only limits the table to them. The columns are Participant, Status, Enrolled, Last active, Sent, Done, Compliance and a 7-day trend with one dot per day: 80 % or more, 60 to 79 %, below 60 %, or no surveys that day.
Complied column of the response export is stricter: it is true only when the server received the response within the response window of the notification schedule (see Offline operation).Missing data and notification status
Every scheduled prompt is stored as a notification record with a status: Scheduled, Sent, Delivered, Opened or Completed, or Failed to deliver or Canceled. When a prompt is completed or canceled, or when its response window has closed, SMAAT assigns it one outcome that explains the result: Completed, Started, not completed, Delivery failed (server), Not delivered to device, Dismissed, Ignored, Ignored after reminders, App error, Canceled or Pending.
The Missing Data tab shows the study-wide figures (Total prompts, Completed, Response rate, Delivery issues, Pending) and a chart of prompts by outcome, a daily chart of Completed, Missed and Pending prompts, and a per-participant table (Participant, Prompts, Completed, Missed, Pending, Response rate, Issues). Each row links to the participant's prompt timeline.
Sent means that the push service accepted the message. Delivered is set by a receipt check that runs between 15 minutes and 24 hours after sending: it means that the push receipt reported the message as handed over to Apple's or Google's push notification service. It does not confirm that the message reached the phone or that the participant saw it.
Offline operation and timestamp integrity
The app works offline. Surveys can be opened and completed without a connection; responses and sensor data are held in a queue on the phone and uploaded when a connection is available.
Each response carries timestamps from two clocks: the device time of the events (start, completion and each answer) and the server time of arrival. Compliance is decided with the server clock: a response counts as complied when the server receives it within the response window after the notification was sent. Responses that no window applies to (self-initiated surveys, geofence and place-visit triggers, and schedules without a response window) count as complied, with a window of 0. An incorrect device clock therefore cannot change compliance. A survey that was completed on time while offline but uploaded after the window closed is marked as not complied, and its ResponseTimeS includes the upload delay. Compare CompletedAt (device clock) with the notification time if offline completion matters for your analysis.
The Data Quality tab of the Quality Centre shows these results in the Timestamp integrity card (Verified OK, Clock skew, Inconsistent, Unverified, Max clock offset). The card counts all datasets, including those excluded from analysis, but it is shown only while at least one dataset is included. The long-format export contains the underlying columns ClientSentAt, ClockOffsetS, SyncDelayS and TimeIntegrity. Flagged responses stay in the dataset; to exclude them, clear Include in Analysis on the Data Overview tab.
Screening for careless responding
Besides the timestamp card, the Data Quality tab contains three screening aids. They use the datasets included in analysis. They flag submissions but do not exclude any data.
- Completion Time Distribution: the time from the first to the last answered question of each submission, as a histogram (from under 10 seconds to over 5 minutes) with the median. When at least five submissions have timing information, submissions at or below the 10th percentile are flagged as Suspiciously fast and those at or above the 90th percentile as Unusually slow.
- Response Pattern Analysis: submissions with at least three Likert, choice, slider or number answers are checked for straight-lining (the same answer to every item) and for low answer variety (few distinct answers among five or more items).
- Dropout Funnel: how many participants completed at least one survey, at least two, the median number and the 75th-percentile number of surveys, and the maximum; and how many were active in the last 7 days.
Mid-study changes: versioning and change log
A study can be changed while it is running. Each answer stores the question text as it was shown to the participant, so later edits do not rewrite past responses. The order of the screens as presented to the participant, including randomised order, is also stored with each response; it is available in the Data Explorer as the column _screen_order and is not part of the file exports.
Each survey also has a version number. A structural change to a survey while the study is Active increases the version, and each response records the version it was collected under. The Change Log tab lists who changed what and when, with the labels Survey edited (with the version change), Config changed and Status changed.
SurveyVersion column. It is included in the long-format CSV and the Responses sheet of the Excel export, but not in the JSON, wide-format CSV or SPSS exports.Participant burden: the Burden Centre
The Burden tab of a study (labelled Burden Centre and headed What this study asks of participants) estimates the time and effort a design asks of each participant. It combines survey length, prompt frequency, study duration and passive sensing, and compares the result with published benchmarks for experience sampling (ESM) studies, in which participants answer short surveys several times a day in daily life. Ecological momentary assessment (EMA) is another name for the same method. A badge in the heading summarises the severity of the findings. The estimate is available for draft studies; measured values are added once responses arrive.
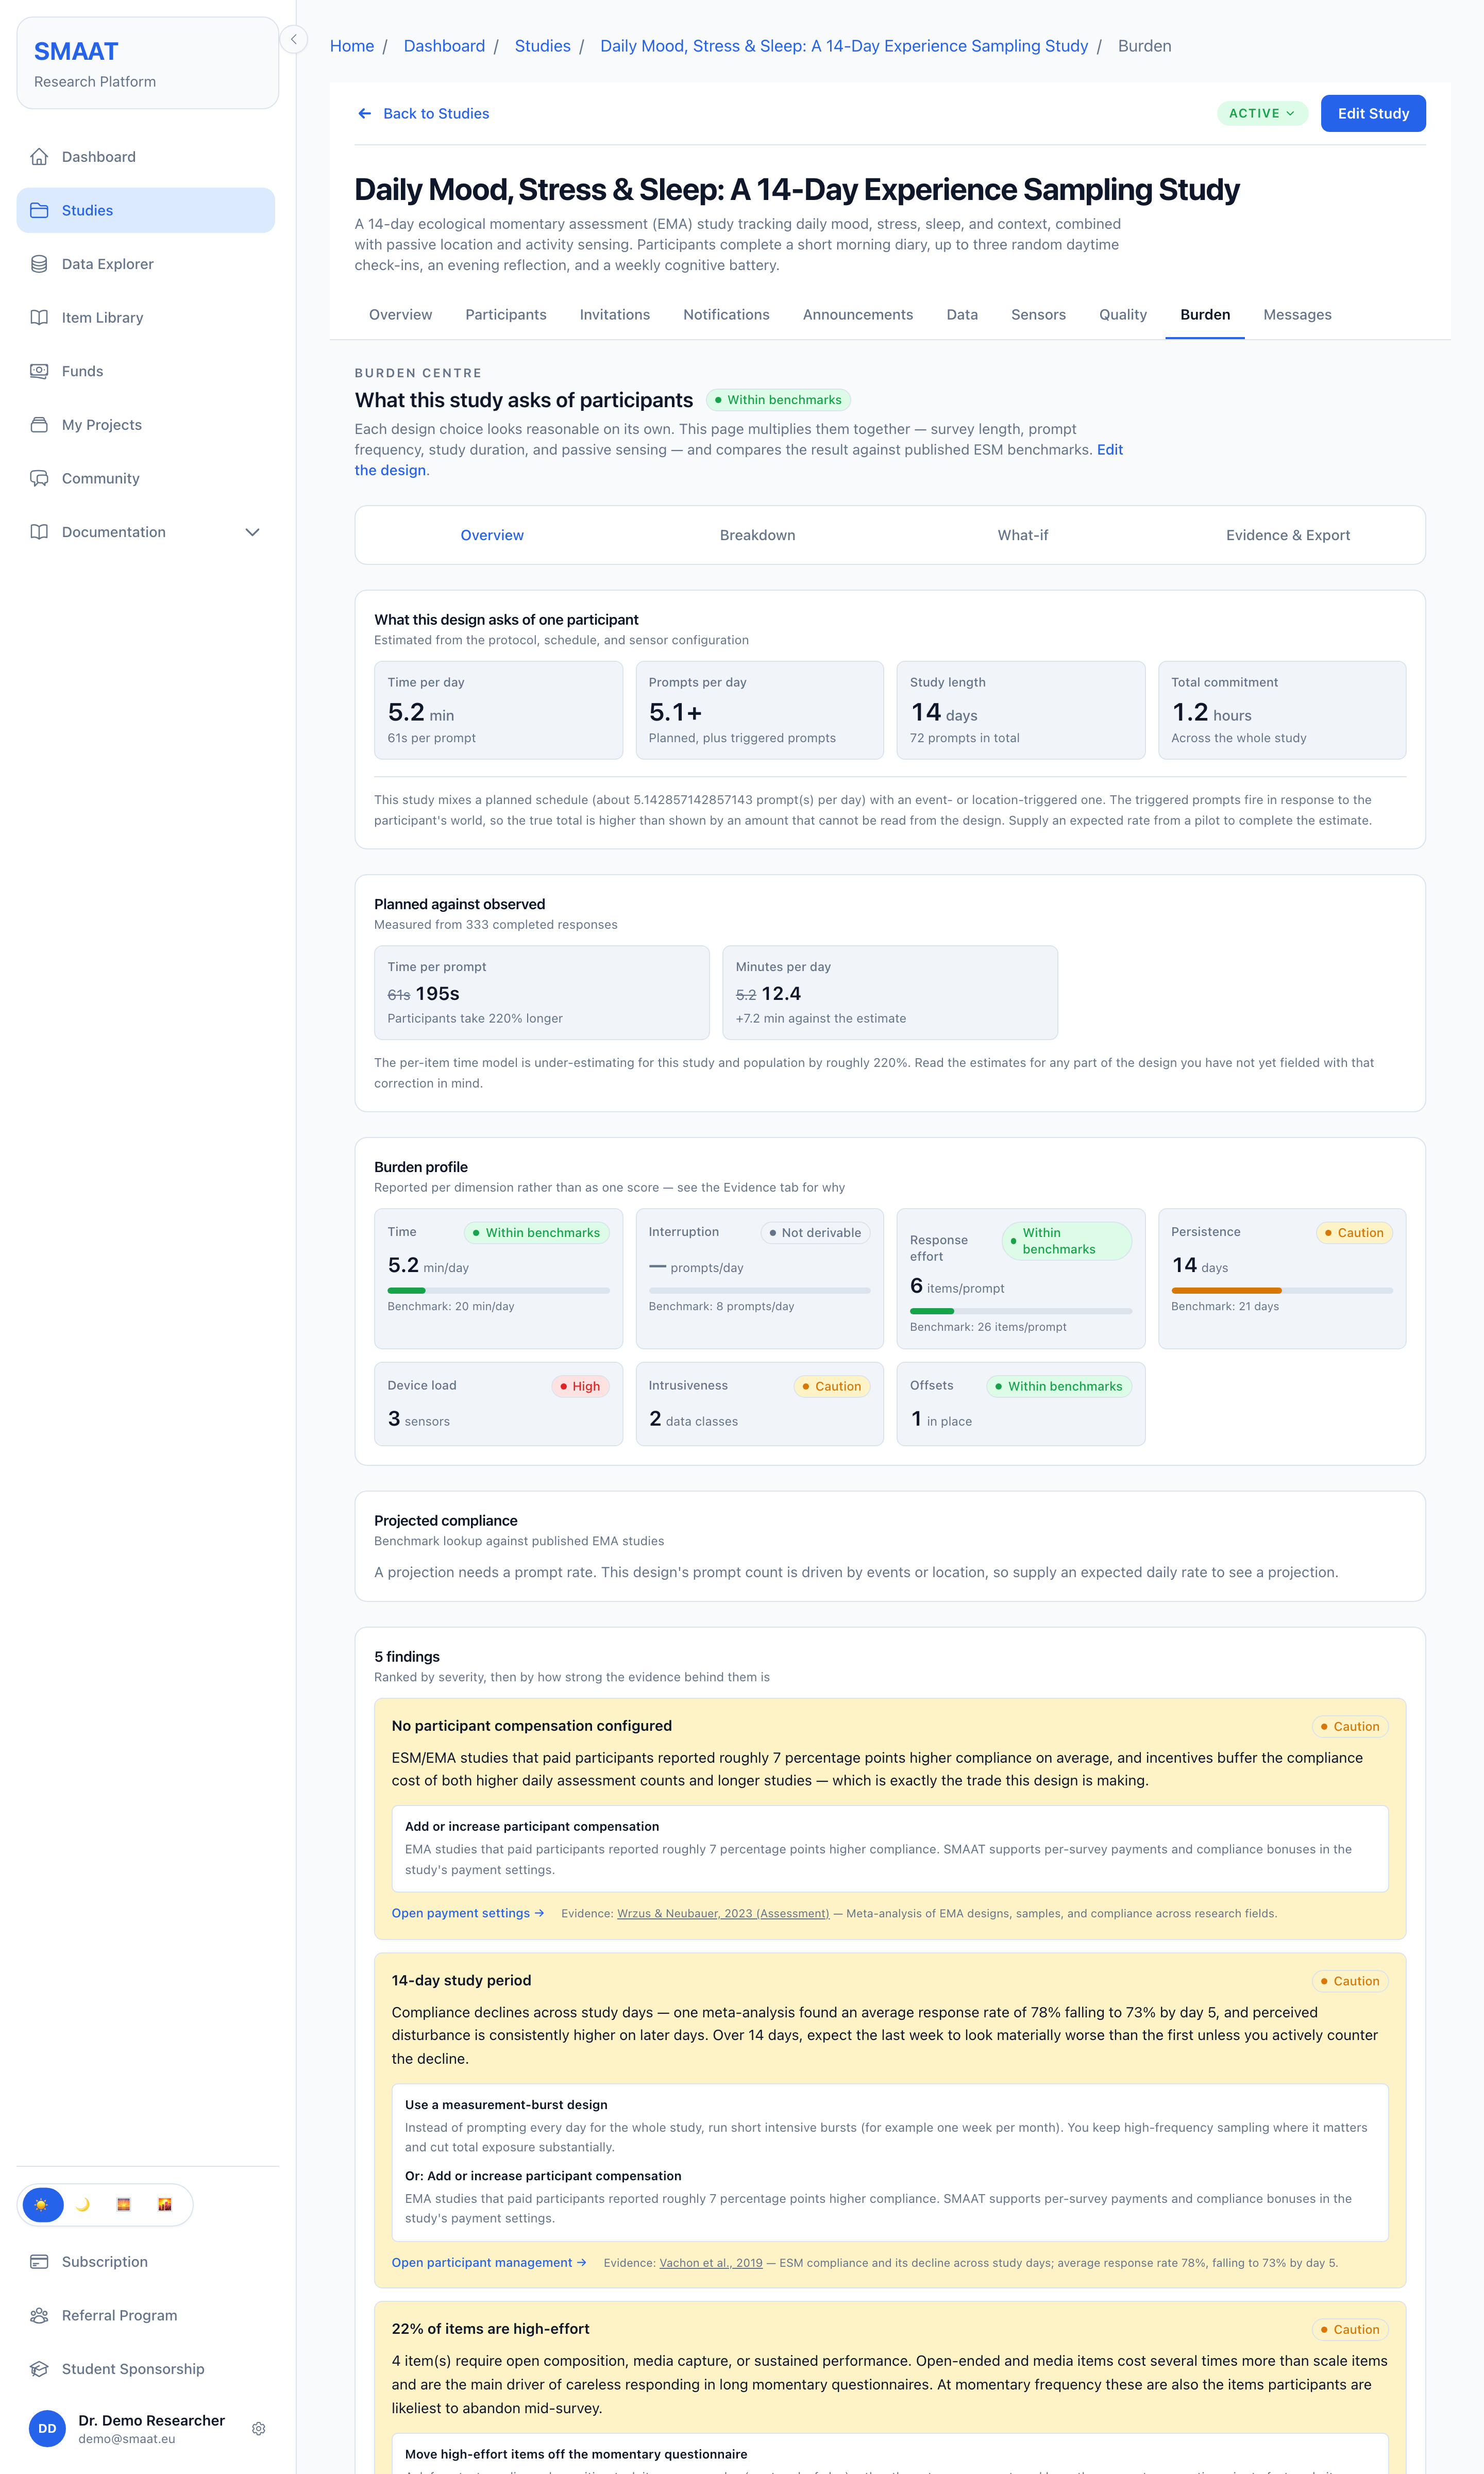
- Overview: time per day, prompts per day, study length and total commitment estimated from the protocol, schedule and sensor configuration; a projected compliance looked up from published EMA studies (a benchmark, not a model of this study); a burden profile per dimension; and findings ranked by severity. Once responses arrive, Planned against observed compares the estimate with measured time per prompt, minutes per day and compliance.
- Breakdown: each survey's contribution to the daily total and, with data, measured completion times (median, 90th percentile), compliance across study days and burden per participant.
- What-if: change prompts per day, items per prompt and study length to see the effect on time per day, total commitment, total prompts, projected compliance and the findings. The study itself is not changed.
- Evidence & Export: the time-commitment text for participants, which the study author can add to the informed consent with Add to informed consent (it is appended to the nature, purpose and duration section and shown on the join screen of the app); a burden statement for ethics applications or pre-registration, with Copy text and Download (Markdown file); the thresholds applied; and the sources, among them Wrzus & Neubauer (2023) and Eisele et al. (2022).
AI conversational item: data handling
The conversational (AI) question type is disabled by default. No data are sent to an AI provider unless a provider key is configured for the study and a survey contains such an item. Conversations are stored under the same protections as other responses.
Identifier redaction and content moderation
The two optional settings serve different purposes: redaction concerns privacy and moderation concerns safety.
Identifier redaction (privacy)
Before a participant's message is sent to the AI provider, SMAAT replaces email addresses and phone numbers with placeholders (for example[redacted-email]). The redaction is pattern-based. It does not detect names, addresses, ID numbers or details described in free text. It changes only what is sent to the provider; the stored research data keep the original message. The reply of the AI can therefore occasionally differ because it received a placeholder.Content moderation (safety)
Each participant message is checked with the provider's moderation classifier (categories such as self-harm, violence, sexual content and harassment). The result (passed, flagged or not checked) is recorded with the AI request on the server. Moderation does not block the conversation or change what the participant sees. The AI usage panel in the study Settings lists the messages flagged in the last seven days (date, participant code and question), or the number checked when none was flagged. Providers without a moderation service record “not checked”. For sensitive topics, add crisis resources so that participants see support information.Using other (OpenAI-compatible) providers
The AI item uses the OpenAI Chat Completions API. It works with any provider or gateway that offers an OpenAI-compatible endpoint, which makes it possible to use other models (for example Llama, Mistral, Claude or Gemini through a gateway), an EU-hosted or zero-retention service, or a self-hosted model that keeps conversations on your own infrastructure.
Under Settings → AI, set the Provider base URL, paste an API key from that provider, select Custom (other provider)… as the model and enter the provider's model ID. The base URL must use HTTPS and should include the provider's path (for example ending in /v1); https://api.openai.com also works.
| Provider | Base URL | Example model ID |
|---|---|---|
| OpenAI (default) | https://api.openai.com | gpt-5.4-nano |
| OpenRouter | https://openrouter.ai/api/v1 | meta-llama/llama-3.3-70b-instruct |
| Together AI | https://api.together.xyz/v1 | meta-llama/Llama-3.3-70B-Instruct-Turbo |
| Groq | https://api.groq.com/openai/v1 | llama-3.3-70b-versatile |
| Mistral | https://api.mistral.ai/v1 | mistral-large-latest |
| Self-hosted (vLLM / Ollama) | https://your-server/v1 | your served model name |
Sensor heterogeneity across devices
Sensors are read through cross-platform interfaces that return each sensor in a standard unit and format, so that readings from iOS and Android phones are stored in a comparable form. The sampling configuration is set per study and applied in the same way on all devices.
DataTruncated column. Each response also records the platform, operating system version, device model, manufacturer and app version at the time of collection (the device columns of the long-format export), so analyses can be stratified or normalised by device.Standard units
| Sensor or metric | Unit |
|---|---|
| Accelerometer | g (multiples of gravity) |
| Gyroscope | rad/s |
| Magnetometer | µT |
| Barometer | hPa |
| Light sensor (Android) | lux |
| Device motion | m/s² (acceleration), rad/s (rotation rate) |
| Pedometer, steps | count |
| Background GPS | degrees (latitude, longitude), metres (accuracy) |
| Resting heart rate | bpm |
| Sleep | stage |
| Active energy | kcal |
| Walking and running distance | m |
| Blood oxygen (SpO2) | % |
| Respiratory rate | breaths/min |
| Heart rate variability | ms; SDNN on iOS, RMSSD on Android |
Normalising across devices
Common steps during analysis:
- Per-participant standardisation: z-score each axis within participant (subtract the participant's mean and divide by the participant's standard deviation) to remove device-level offsets and scale differences. The raw survey-time samples are in the sensor columns of the long-format export (for example
AccelerometerData); the Data Explorer provides per-submission means such as_accel_mean_x. - GPS accuracy filtering: drop location samples whose
accuracy(metres) exceeds a threshold before computing distances. The field is part of each sample in the GPS files downloaded from the Sensors tab and of the Table view in Preprocess Data. - Platform awareness: use the
PlatformandOSVersioncolumns of the long-format export, and the Unit / Platform column of the Sensors tab, to separate iOS and Android streams and to convert units where needed (for example g to m/s²).