Dot-probe
A picture task that measures attentional bias: whether attention goes to pictures of one category, such as smoking or alcohol cues, more than to matched neutral pictures.
Try this task
Configure parameters and run an interactive preview exactly as participants will experience it. No data is recorded.
Configure preview
Adjust parameters below, then start the preview on the right.
Include practice trials
Shown with feedback before the main task
Task parameters
Each trial: the fixation cross (also the interval between trials), then the two pictures above and below where it was, without the cross, then a dot where one of them was, until the participant taps the top or bottom half. Practice uses neutral pairs and gives feedback.
Time limit for the dot: none by default, as in Jones et al. (2018). On a phone used without supervision, a limit keeps a trial from waiting indefinitely; a published value is 3000 ms (Fuchs-Leitner et al., 2026).
6 experimental + 2 filler pairs × 4 × 5 = 160 trials in random order, about 5 min with 10 practice trials. Each repetition shows every pair 4 times: either picture on top, each time with the dot on top and at the bottom.
Defaults follow the standard alcohol visual probe task of Jones, Christiansen & Field (2018): a 500 ms fixation cross that starts each trial (they report no other interval between trials), the pictures for 500 ms, then the dot until the response; 10 practice and 160 main trials; scoring on correct trials with RTs of 200–2000 ms, then without RTs more than 2 SD from the participant's mean. Differences that remain with the built-in pictures: 6 cue pairs (Jones et al.: 8) and 25% filler trials (Jones et al.: 20%); the pictures are above and below the centre and the participant taps the dot's half (Jones et al.'s standard task: left and right, with a key for the dot's location).
Published picture dot-probe tasks use about 100–160 or more main trials, and even then the bias score is not reliable from a single session. For short repeated assessments, use fewer repetitions and average the bias across sessions or model the trial-level data. 1 repetition with 8 experimental and 2 filler pairs is the 40-trial RDoC version.
Pictures
Pairs
 |
|
 |
|
 |
|
 |
|
 |
|
 |
|
 |
|
 |
|
E = experimental pair (cue | neutral), F = filler pair. Pairing follows the order of the pictures within each category of the image set: the 1st cue picture goes with the 1st neutral picture, the 2nd with the 2nd, and so on; filler pictures are paired 1st with 2nd, 3rd with 4th. Change the order with the arrows in the image manager.
Outputs: bias score = mean RT when the dot replaces the neutral picture − mean RT when it replaces the cue picture (correct experimental trials with RTs of 200–2000 ms, then without RTs more than 2 SD from the participant's mean: the “2 SD procedure” of Jones et al., 2018), also from medians and within each dot position; positive = attention toward the cue. Jones et al. found that no outlier rule improved the reliability; the trim is there to match their procedure. Plus the number of trials the 2 SD step removed, accuracy, wrong-half and no-response counts, and per trial the pictures, positions, response, RT and the measured time the pictures were on screen. One short session gives an unreliable bias score: aggregate across sessions or model the trial-level data.
This is a researcher preview. No participant data is recorded.
Simulated participant view
Dot-probe
A picture task that measures attentional bias: whether attention goes to pictures of one category, such as smoking or alcohol cues, more than to matched neutral pictures.
No data is recorded
Participant experience on smartphone
A fixation cross for 500 ms, then two pictures for 500 ms, one above and one below where the cross was; the cross disappears when they appear (an option keeps it visible). The app is held upright, so the pair is stacked rather than side by side as on a computer screen; vertical pairs have been used since the first dot-probe studies and in smartphone versions. Then the pictures disappear and a dot appears where one of them was, and stays until the participant taps the half of the screen with the dot (an optional time limit ends the trial without a response); each half is one large touch target.
When to use
Useful in addiction, eating, anxiety and health-behaviour research where attention to cue pictures is a target outcome, including measurement in daily life: a standard dot-probe task has been run on handheld computers during a week of ecological momentary assessment (Kerst & Waters, 2014).
When not to use
Not a diagnostic instrument. The bias score is a difference between two mean reaction times and has poor reliability, especially from one short session, so the task suits group comparisons and repeated measurement better than precise single-person scores.
How to use in a study
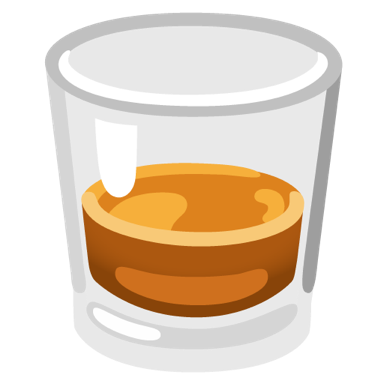
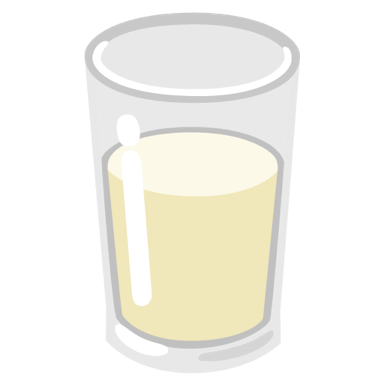
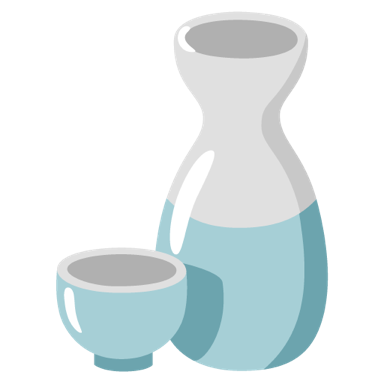
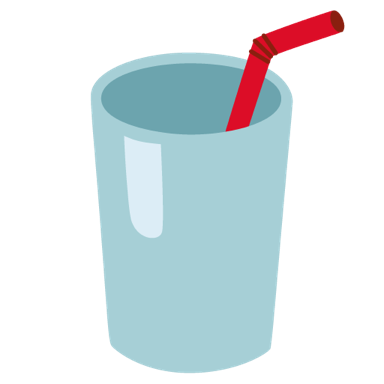
For research, upload matched picture pairs: each cue picture with a neutral picture of similar size, colour, complexity and layout. Pairing follows the order of the pictures within each category of the image set, so the n-th cue picture is paired with the n-th neutral picture; put them in order with the arrows in the image manager. Neutral filler pairs are optional. The built-in pictures (6 alcoholic drinks, each with a soft drink in a similar container) are a demo default for piloting and teaching, not a validated set. Every default follows the standard alcohol visual probe task of Jones, Christiansen & Field (2018): a 500 ms fixation cross that starts each trial (they report no other interval between trials), the pictures for 500 ms, the dot until the response, 10 practice and 160 main trials, and the bias from correct trials with RTs of 200–2000 ms, then without RTs more than 2 SD from the participant's mean. Jones et al. do not say whether the cross stays during the pictures; the alcohol studies that do remove it (Luehring-Jones et al., 2017; Fuchs-Leitner et al., 2026). Differences from Jones et al. that remain with the built-in pictures: 6 cue pairs instead of 8, 25% filler trials instead of 20%, and a vertical layout with a tap on the dot's half instead of left and right pictures with a key for the dot's location. For short repeated assessments, use fewer repetitions and aggregate the bias score across sessions or model the trial-level data.
Researcher-configurable parameters
- Pictures: built-in drink and object pictures, or your own image set with cue, neutral and optional filler pictures
- Fixation cross (default 500 ms, Jones et al., 2018), which is also the interval between trials
- Fixation cross during the pictures (default removed, as in Luehring-Jones et al., 2017 and Fuchs-Leitner et al., 2026; option: visible, as in Kappenman et al., 2014)
- How long the pictures are shown (default 500 ms, Jones et al., 2018; the usual duration for appetitive cues)
- Time limit for the dot (default none: the dot stays until the response, Jones et al., 2018; e.g. 3000 ms, Fuchs-Leitner et al., 2026, then recorded as no response)
- Practice trials with feedback (default 10, Jones et al., 2018)
- Repetitions (default 5: each pair 20 times, 160 trials with the built-in pictures, as in Jones et al., 2018; 1 = 4 times per pair)
Outputs collected
- Bias score: mean RT on incongruent − mean RT on congruent trials (correct experimental trials with RTs of 200–2000 ms, then within 2 SD of the participant's mean, the 2 SD procedure of Jones et al., 2018), and the same from medians
- Bias computed separately for dots on top and at the bottom, and their mean, from the same trials
- Mean RT and number of scored trials, congruent and incongruent, and the number of trials removed by the 2 SD step
- Accuracy, wrong-half responses and missed dots
- Per trial: the two pictures and their positions, the dot position, congruence, response, RT, and the measured time the pictures were on screen
Interpretation notes
On a congruent trial the dot replaces the cue picture; on an incongruent trial it replaces the neutral picture. A positive bias score means faster responses at the cue's position, which is read as attention toward the cue; a negative score as attention away from it. Filler pairs (two neutral pictures) do not enter the score and make the cue pairs less predictable. In a vertical layout people tend to look at the upper picture first, so the task also reports the bias within each dot position; Price et al. (2015) found the dot-bottom index the most stable. Jones et al. (2018) found no evidence that any outlier rule, the 2 SD trim included, improved the internal consistency of the bias score; the trim is applied to match their procedure, not to make the score more reliable. The bias score from one short session is unreliable (Schmukle, 2005); aggregate it across sessions, or model the trial-level RTs, e.g. with random effects for participants and picture pairs. SMAAT places the onsets of the pictures and the dot after the screen has been drawn and takes RT from the touch-down timestamp, but this timing has not yet been validated on real devices.
Scientific evidence
- In a smoking-cue dot-probe task, attention shifts towards smoking pictures were related to the severity of nicotine dependence, smoking behaviour and breath carbon monoxide.
- Smokers completed a standard dot-probe task on handheld computers in their daily environment for a week, which measured their attentional bias outside the lab.
- The dot-probe bias score showed poor internal consistency and test–retest reliability.
Read more
- Vollstädt-Klein et al. (2011), attention shift towards smoking cues
- Kerst & Waters (2014), a dot-probe task on handheld computers in daily life
- Price et al. (2015), vertical dot-probe layouts and the stability of the bias score
- Jones, Christiansen & Field (2018), the standard alcohol visual probe task and its reliability
- Luehring-Jones et al. (2017), an alcohol dot-probe task with the fixation cross removed at picture onset
- Fuchs-Leitner et al. (2026), an alcohol dot-probe task with a 3000 ms response limit
- Kappenman et al. (2014), a dot-probe task with the fixation cross visible throughout
- Schmukle (2005), unreliability of the dot probe task
Related tasks
Add Dot-probe to your ESM study on SMAAT — free to get started.